
Point at a box to see its product.
12 x 12 chart, 1 page.
Score: 0 of 0 right.
Type the answer for the marked box, or tap any box to show its answer.
How to read a multiplication chart
A multiplication chart is a grid of times tables. The numbers along the top row and down the left column are the factors. Every other square holds the product of its row number and its column number.
To find 7 × 8, put one finger on 7 in the left column and another on 8 in the top row. Slide them toward each other until they meet. The square where they meet says 56. You can also start from 8 in the left column and 7 in the top row. You land on 56 again.
How to make your own chart
- Pick the numbers. Tap a size such as 1-12, or choose Custom and type any range or list, like rows 6-9 and columns 1-12.
- Pick the answers and colors. Keep all answers for a reference chart. Choose Blank or Some blank for a practice sheet. Pick Black & white or Ink saver if you print in gray.
- Download the PDF. The file fits one Letter or A4 page. Practice sheets get an answer key on page 2.
Use Copy link to save your settings. The link opens the same chart again, so a teacher can send one link to a whole class.
Which chart size to print
| Chart | Best for | Facts on it |
|---|---|---|
| 1-10 | Grades 2 and 3, first time learning | 100 |
| 1-12 | Grades 3 to 5, the standard school chart | 144 |
| 1-15 | Grade 5 and up, extra practice past 12 | 225 |
| 1-20 | Middle school, mental math, squares to 400 | 400 |
| 1-25 and 1-30 | Number patterns, factors and puzzles | 625 and 900 |
In the United States, the Common Core standard asks students to know all products of two one-digit numbers from memory by the end of grade 3. In England, Year 4 students take the multiplication tables check, which covers every table up to 12 × 12. That is why the 1-12 chart is the one most classrooms use. See the multiplication chart 1-12 page for ready-made PDFs.
The full 1-12 multiplication table
Here is the standard chart as text. Every product from 1 × 1 to 12 × 12 is listed.
| Row number times column number | 1 | 2 | 3 | 4 | 5 | 6 | 7 | 8 | 9 | 10 | 11 | 12 |
|---|---|---|---|---|---|---|---|---|---|---|---|---|
| 1 | 1 | 2 | 3 | 4 | 5 | 6 | 7 | 8 | 9 | 10 | 11 | 12 |
| 2 | 2 | 4 | 6 | 8 | 10 | 12 | 14 | 16 | 18 | 20 | 22 | 24 |
| 3 | 3 | 6 | 9 | 12 | 15 | 18 | 21 | 24 | 27 | 30 | 33 | 36 |
| 4 | 4 | 8 | 12 | 16 | 20 | 24 | 28 | 32 | 36 | 40 | 44 | 48 |
| 5 | 5 | 10 | 15 | 20 | 25 | 30 | 35 | 40 | 45 | 50 | 55 | 60 |
| 6 | 6 | 12 | 18 | 24 | 30 | 36 | 42 | 48 | 54 | 60 | 66 | 72 |
| 7 | 7 | 14 | 21 | 28 | 35 | 42 | 49 | 56 | 63 | 70 | 77 | 84 |
| 8 | 8 | 16 | 24 | 32 | 40 | 48 | 56 | 64 | 72 | 80 | 88 | 96 |
| 9 | 9 | 18 | 27 | 36 | 45 | 54 | 63 | 72 | 81 | 90 | 99 | 108 |
| 10 | 10 | 20 | 30 | 40 | 50 | 60 | 70 | 80 | 90 | 100 | 110 | 120 |
| 11 | 11 | 22 | 33 | 44 | 55 | 66 | 77 | 88 | 99 | 110 | 121 | 132 |
| 12 | 12 | 24 | 36 | 48 | 60 | 72 | 84 | 96 | 108 | 120 | 132 | 144 |
Patterns that make the times tables easier
A 12 × 12 chart has 144 squares, but you do not have to learn 144 separate facts. The patterns below cut the work down fast.
- Order does not matter. 3 × 7 and 7 × 3 are both 21. The chart is a mirror image across its diagonal, so once you know one half you know the other. That takes 144 facts down to 78.
- Square numbers sit on the diagonal. 1, 4, 9, 16, 25, 36, 49, 64, 81, 100, 121 and 144 run from the top left corner to the bottom right. Turn on Square numbers in the generator to shade them.
- The 1s, 2s, 5s and 10s are quick. Times 1 keeps the number. Times 2 doubles it. Times 5 always ends in 0 or 5. Times 10 adds a zero.
- The 4s are double the 2s. To find 4 × 7, double 7 to get 14, then double again to get 28.
- The 9s add up to 9. The digits of 9 × 2 through 9 × 10 always add to 9: 18, 27, 36, 45. The tens digit is one less than the number you multiply by.
- The 9s finger trick. Hold up 10 fingers. To find 9 × 4, fold down the 4th finger from the left. Three fingers to the left are the tens and six to the right are the ones: 36.
- The 11s repeat the digit. 11 × 3 is 33 and 11 × 8 is 88, up to 11 × 9. After that, 11 × 11 is 121 and 11 × 12 is 132.
- 6 times an even number ends in that number. 6 × 4 = 24, 6 × 6 = 36, 6 × 8 = 48.
Once these are done, the facts left to learn by heart are only a handful: 6 × 7, 6 × 8, 7 × 7, 7 × 8, 8 × 8 and the 12s. Use the generator’s One times table highlight to practice a single row.
How to memorize the times tables in one week
Short daily practice works better than one long session. This plan uses about 10 minutes a day and the sheets from this page.
- Day 1: Print a full color 1-12 chart and put it where homework happens. Read the 1s, 2s, 5s and 10s rows out loud.
- Day 2: Print a chart with Some blank at 25%. Fill it in, then check the answer key.
- Day 3: Learn the 3s, 4s and 9s using the patterns above.
- Day 4: Print Some blank at 50%. Circle every wrong answer.
- Day 5: Practice the circled facts and the 6s, 7s, 8s, 11s and 12s.
- Day 6: Turn on Practice on screen and try to beat yesterday’s score.
- Day 7: Fill in a fully blank chart from memory. Keep that sheet. Compare it to one done a month later.
The goal is to stop needing the chart. Use it as a reference while learning, then take it away a little at a time.
Free printable multiplication charts
These PDFs are ready to print. Each one comes in Letter and A4, in color and black and white. Print at Actual size or 100% so the grid is not shrunk.
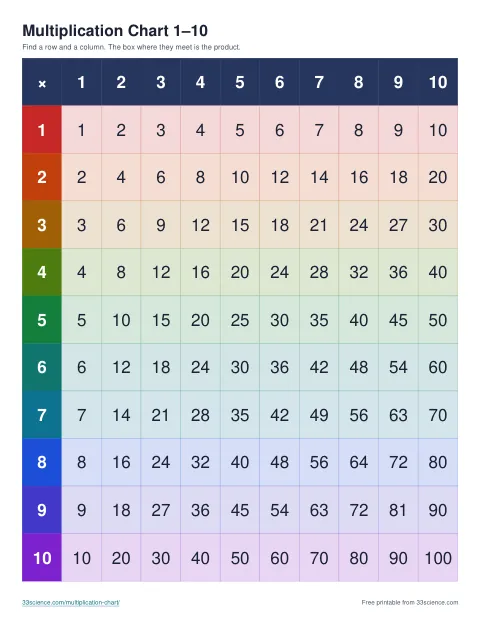
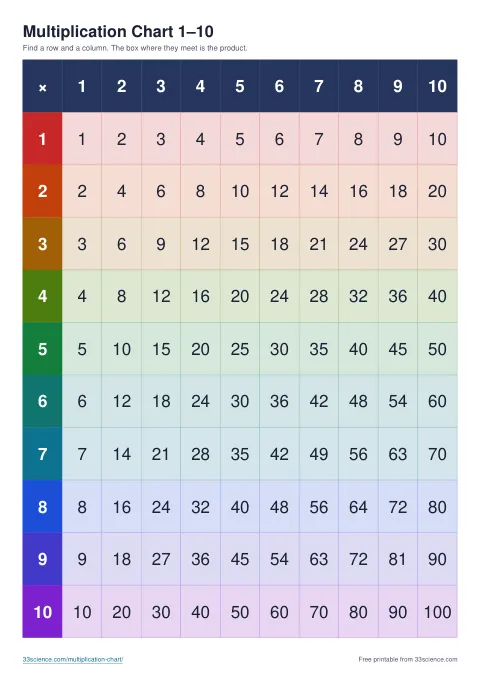
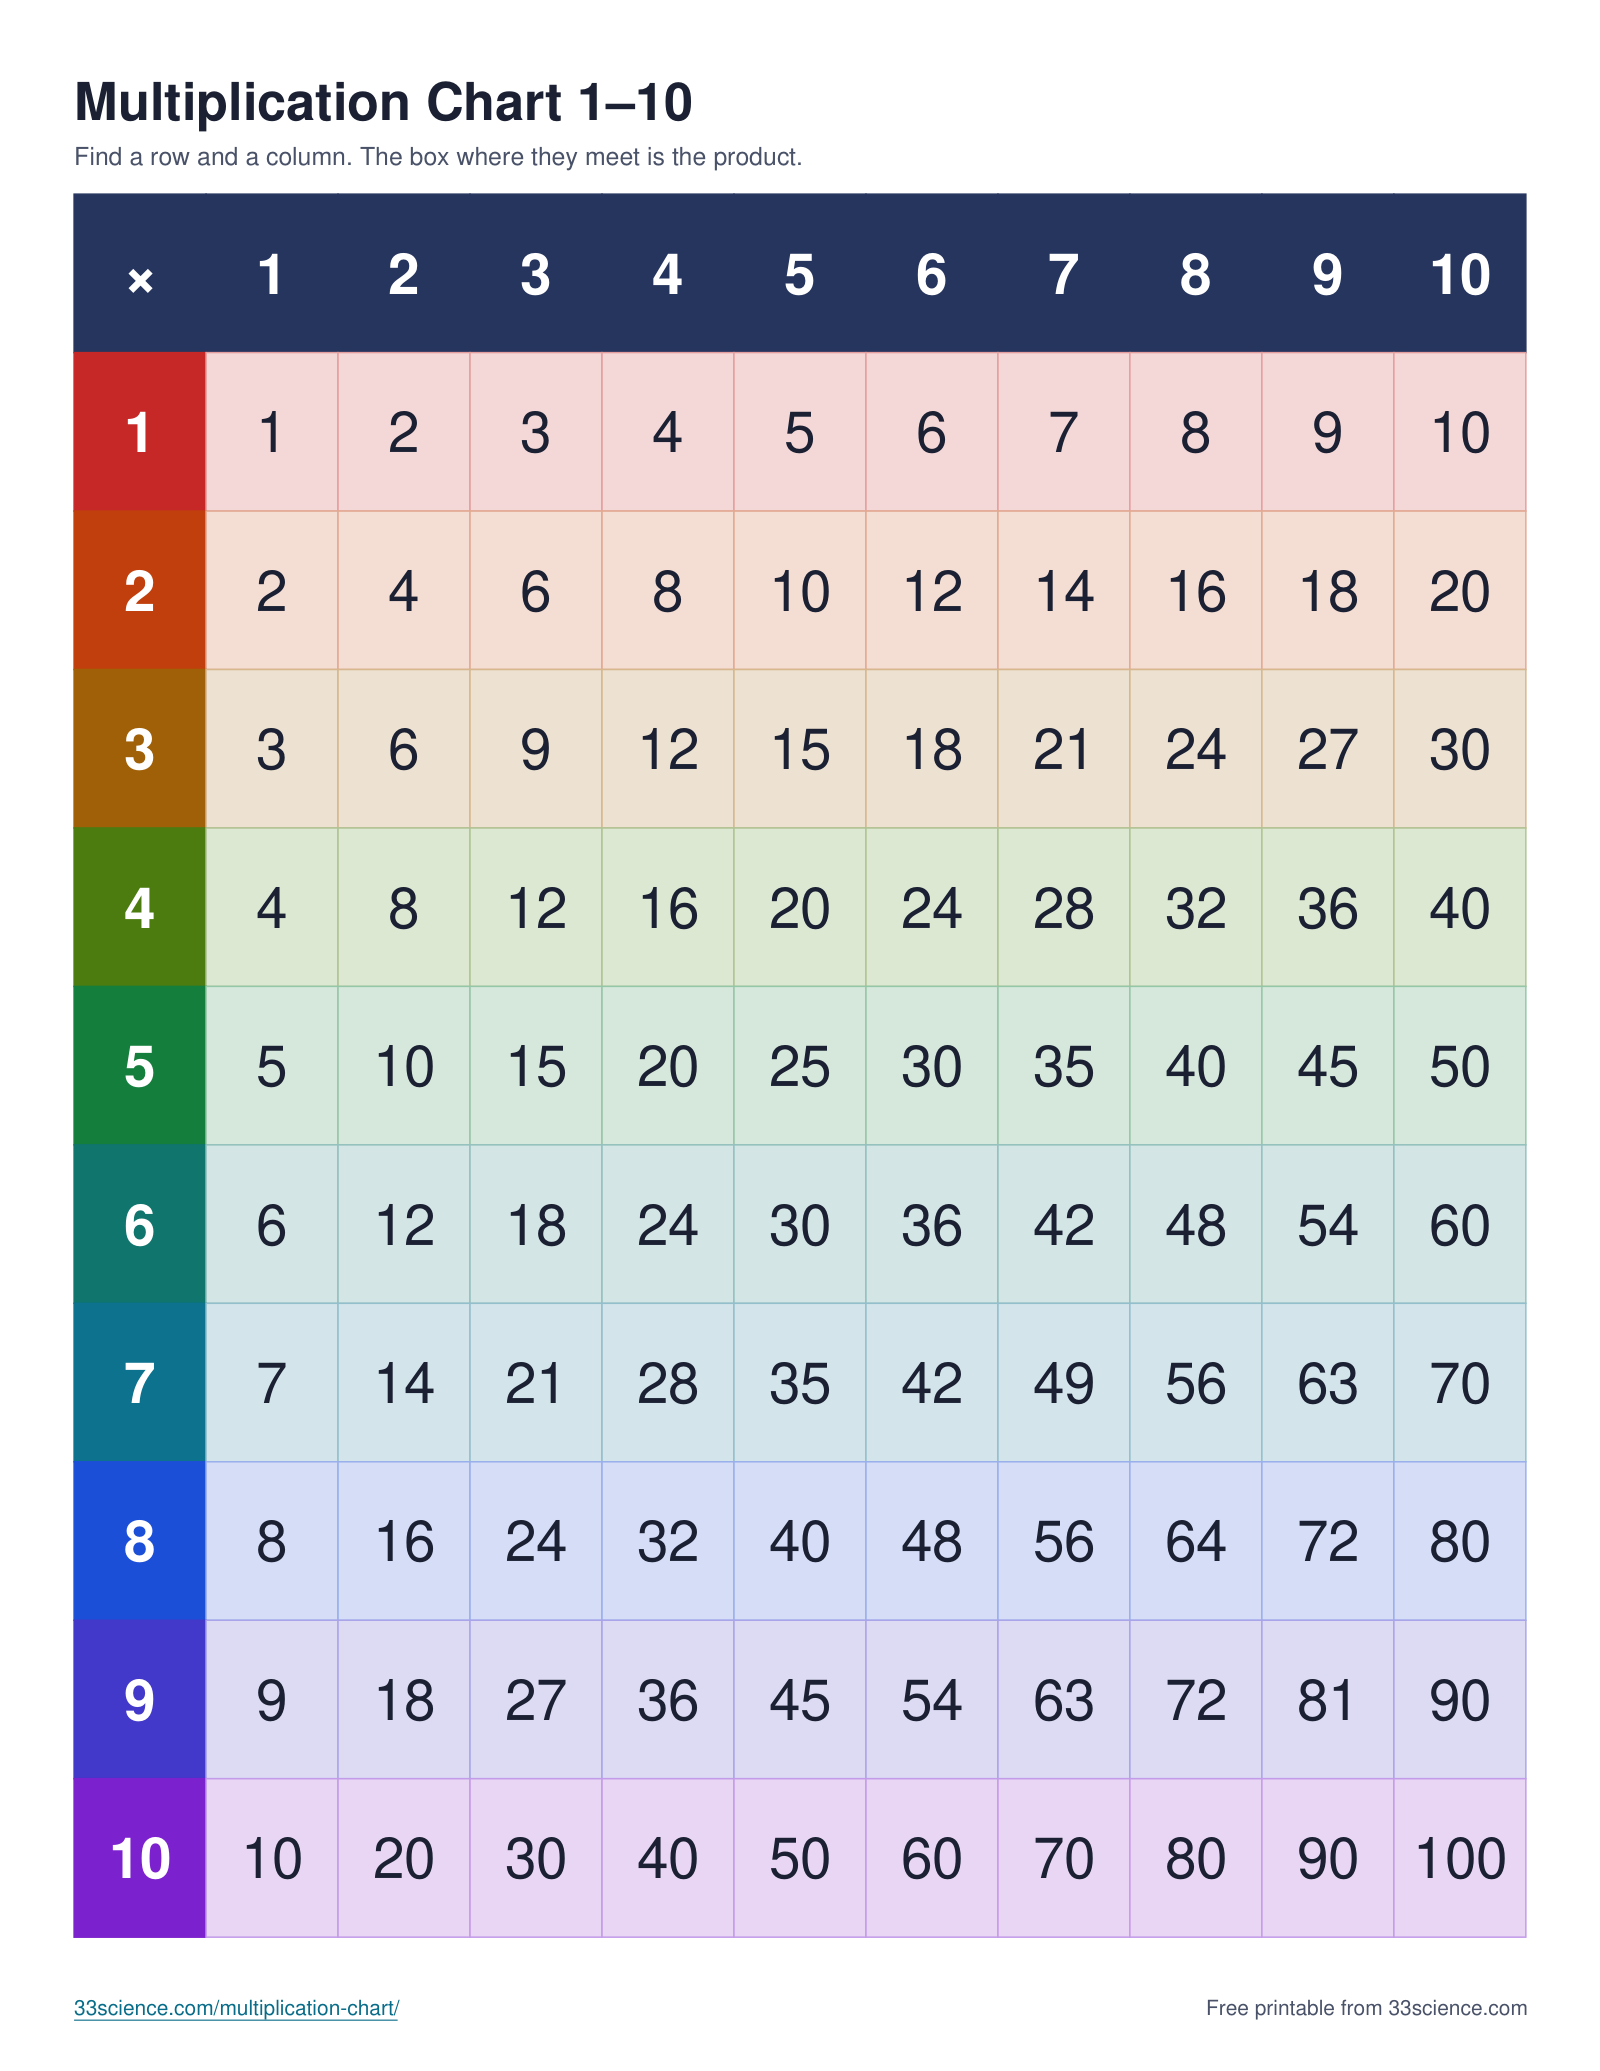
Multiplication chart 1-10
US Letter · 1 page · 4 KB · PDF
Products up to 100. A small chart for learning the first facts.
PNG imageDownload1600 x 2071 px · 160 KB
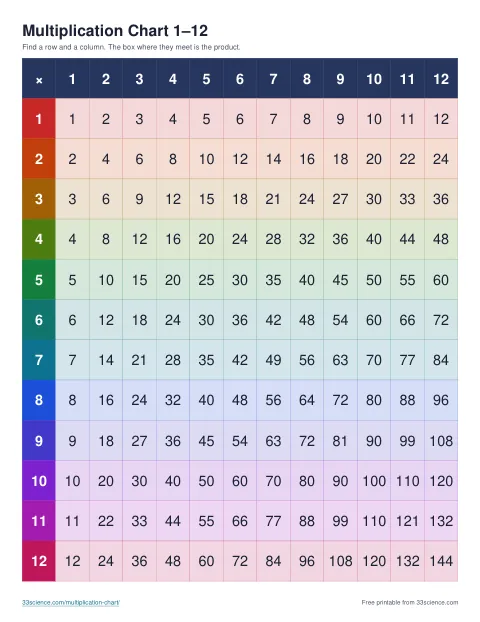
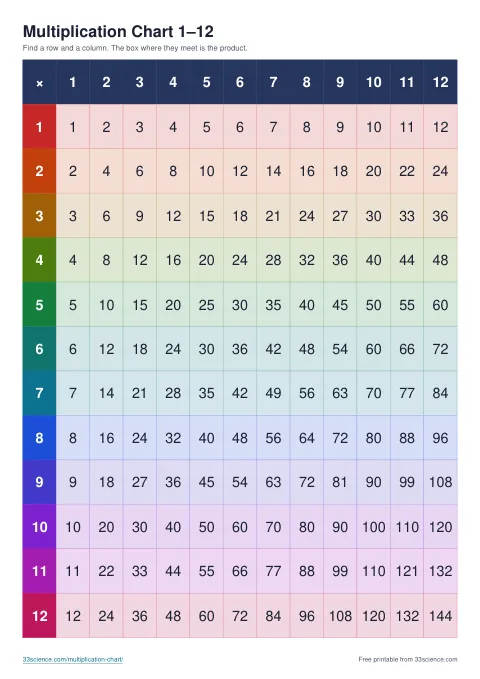
Multiplication chart 1-12
US Letter · 1 page · 5 KB · PDF
Rows and columns from 1 to 12, with products up to 144.
PNG imageDownload1600 x 2071 px · 172 KB
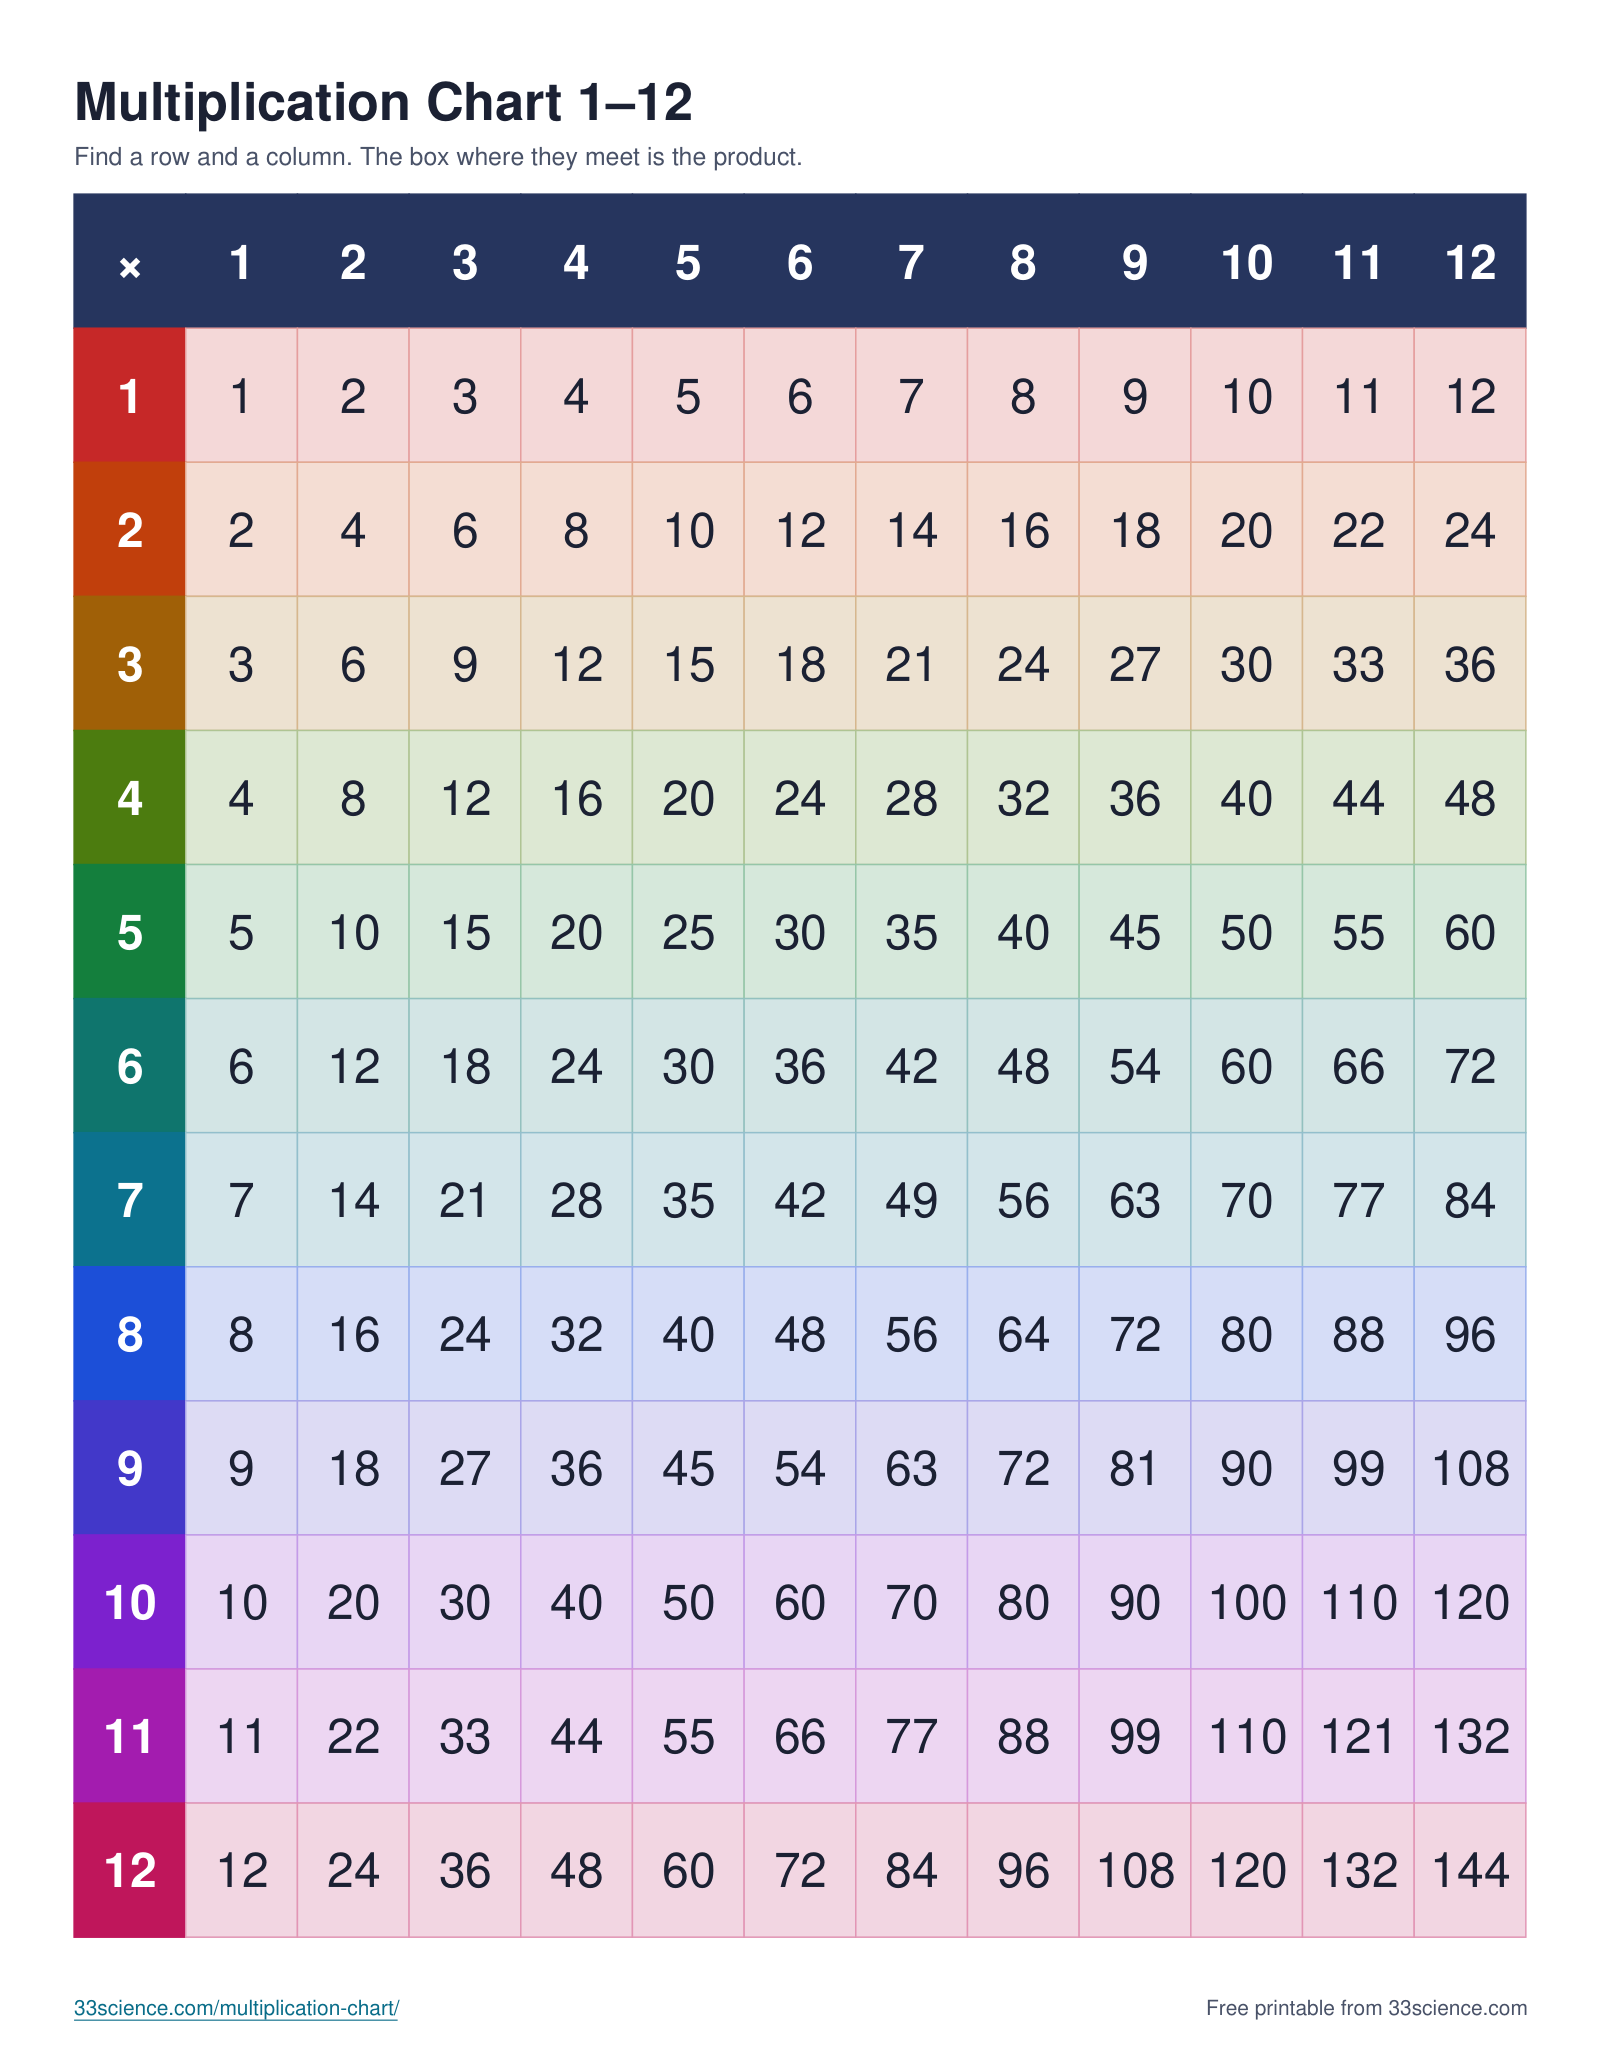
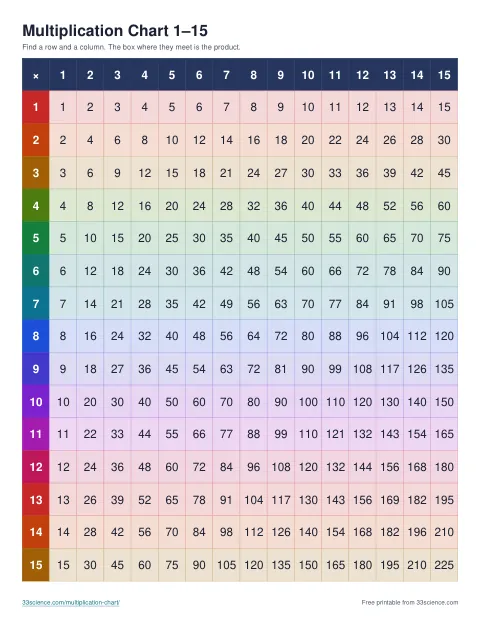
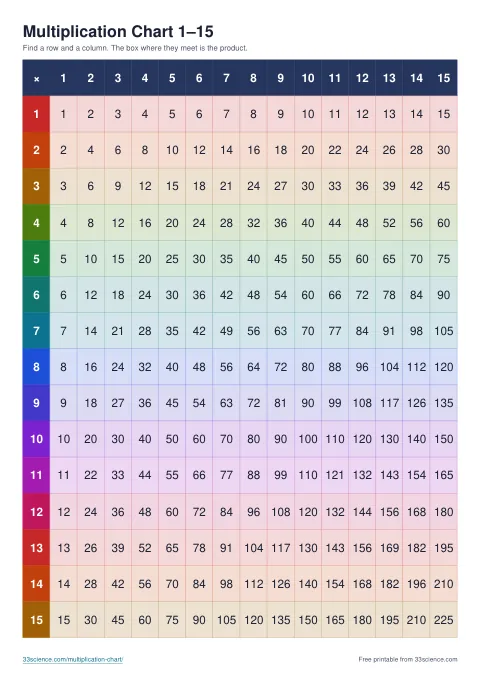
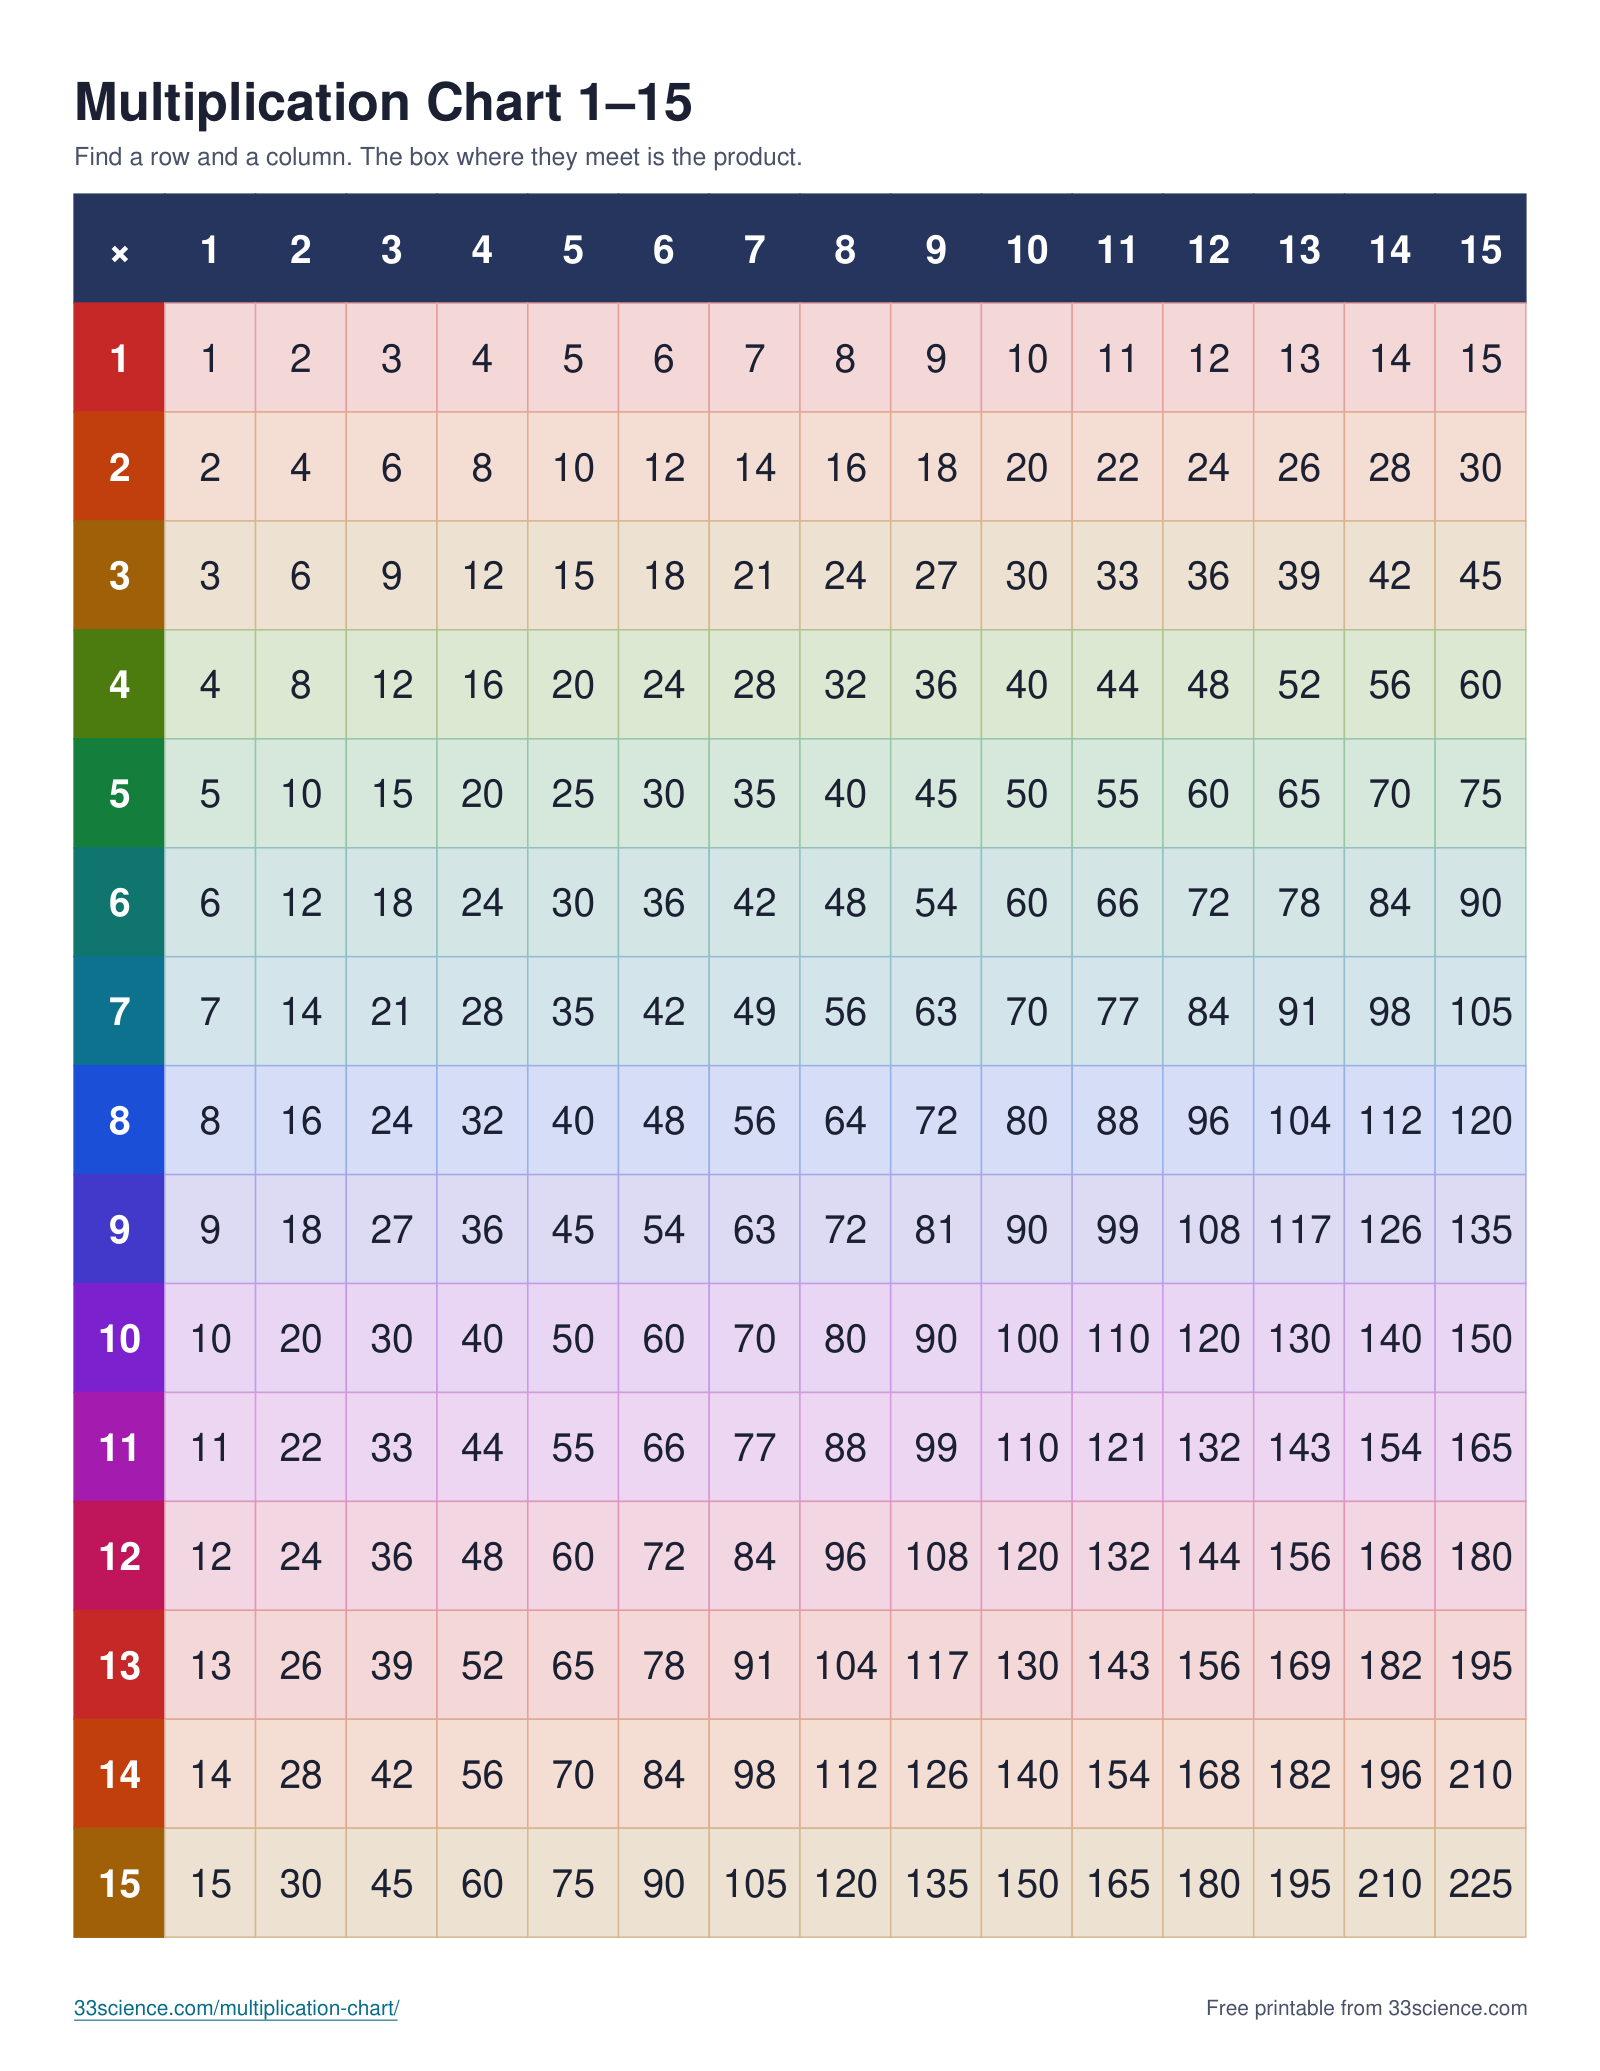
Multiplication chart 1-15
US Letter · 1 page · 6 KB · PDF
Rows and columns from 1 to 15, with products up to 225.
PNG imageDownload1600 x 2071 px · 241 KB
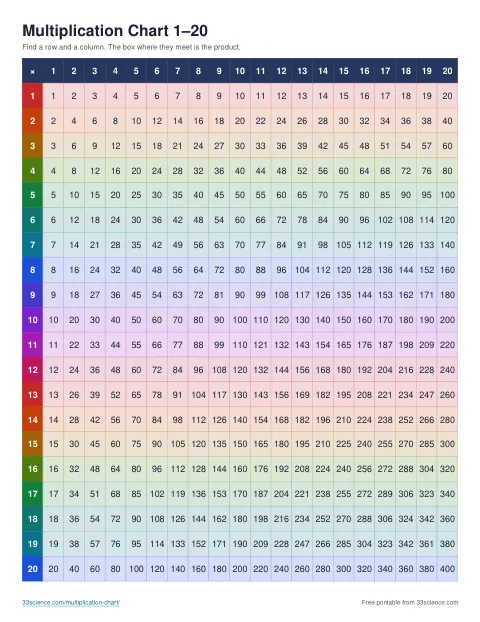
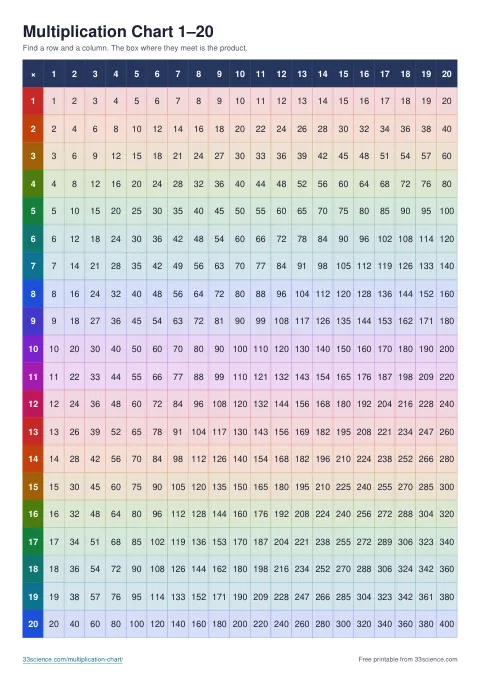
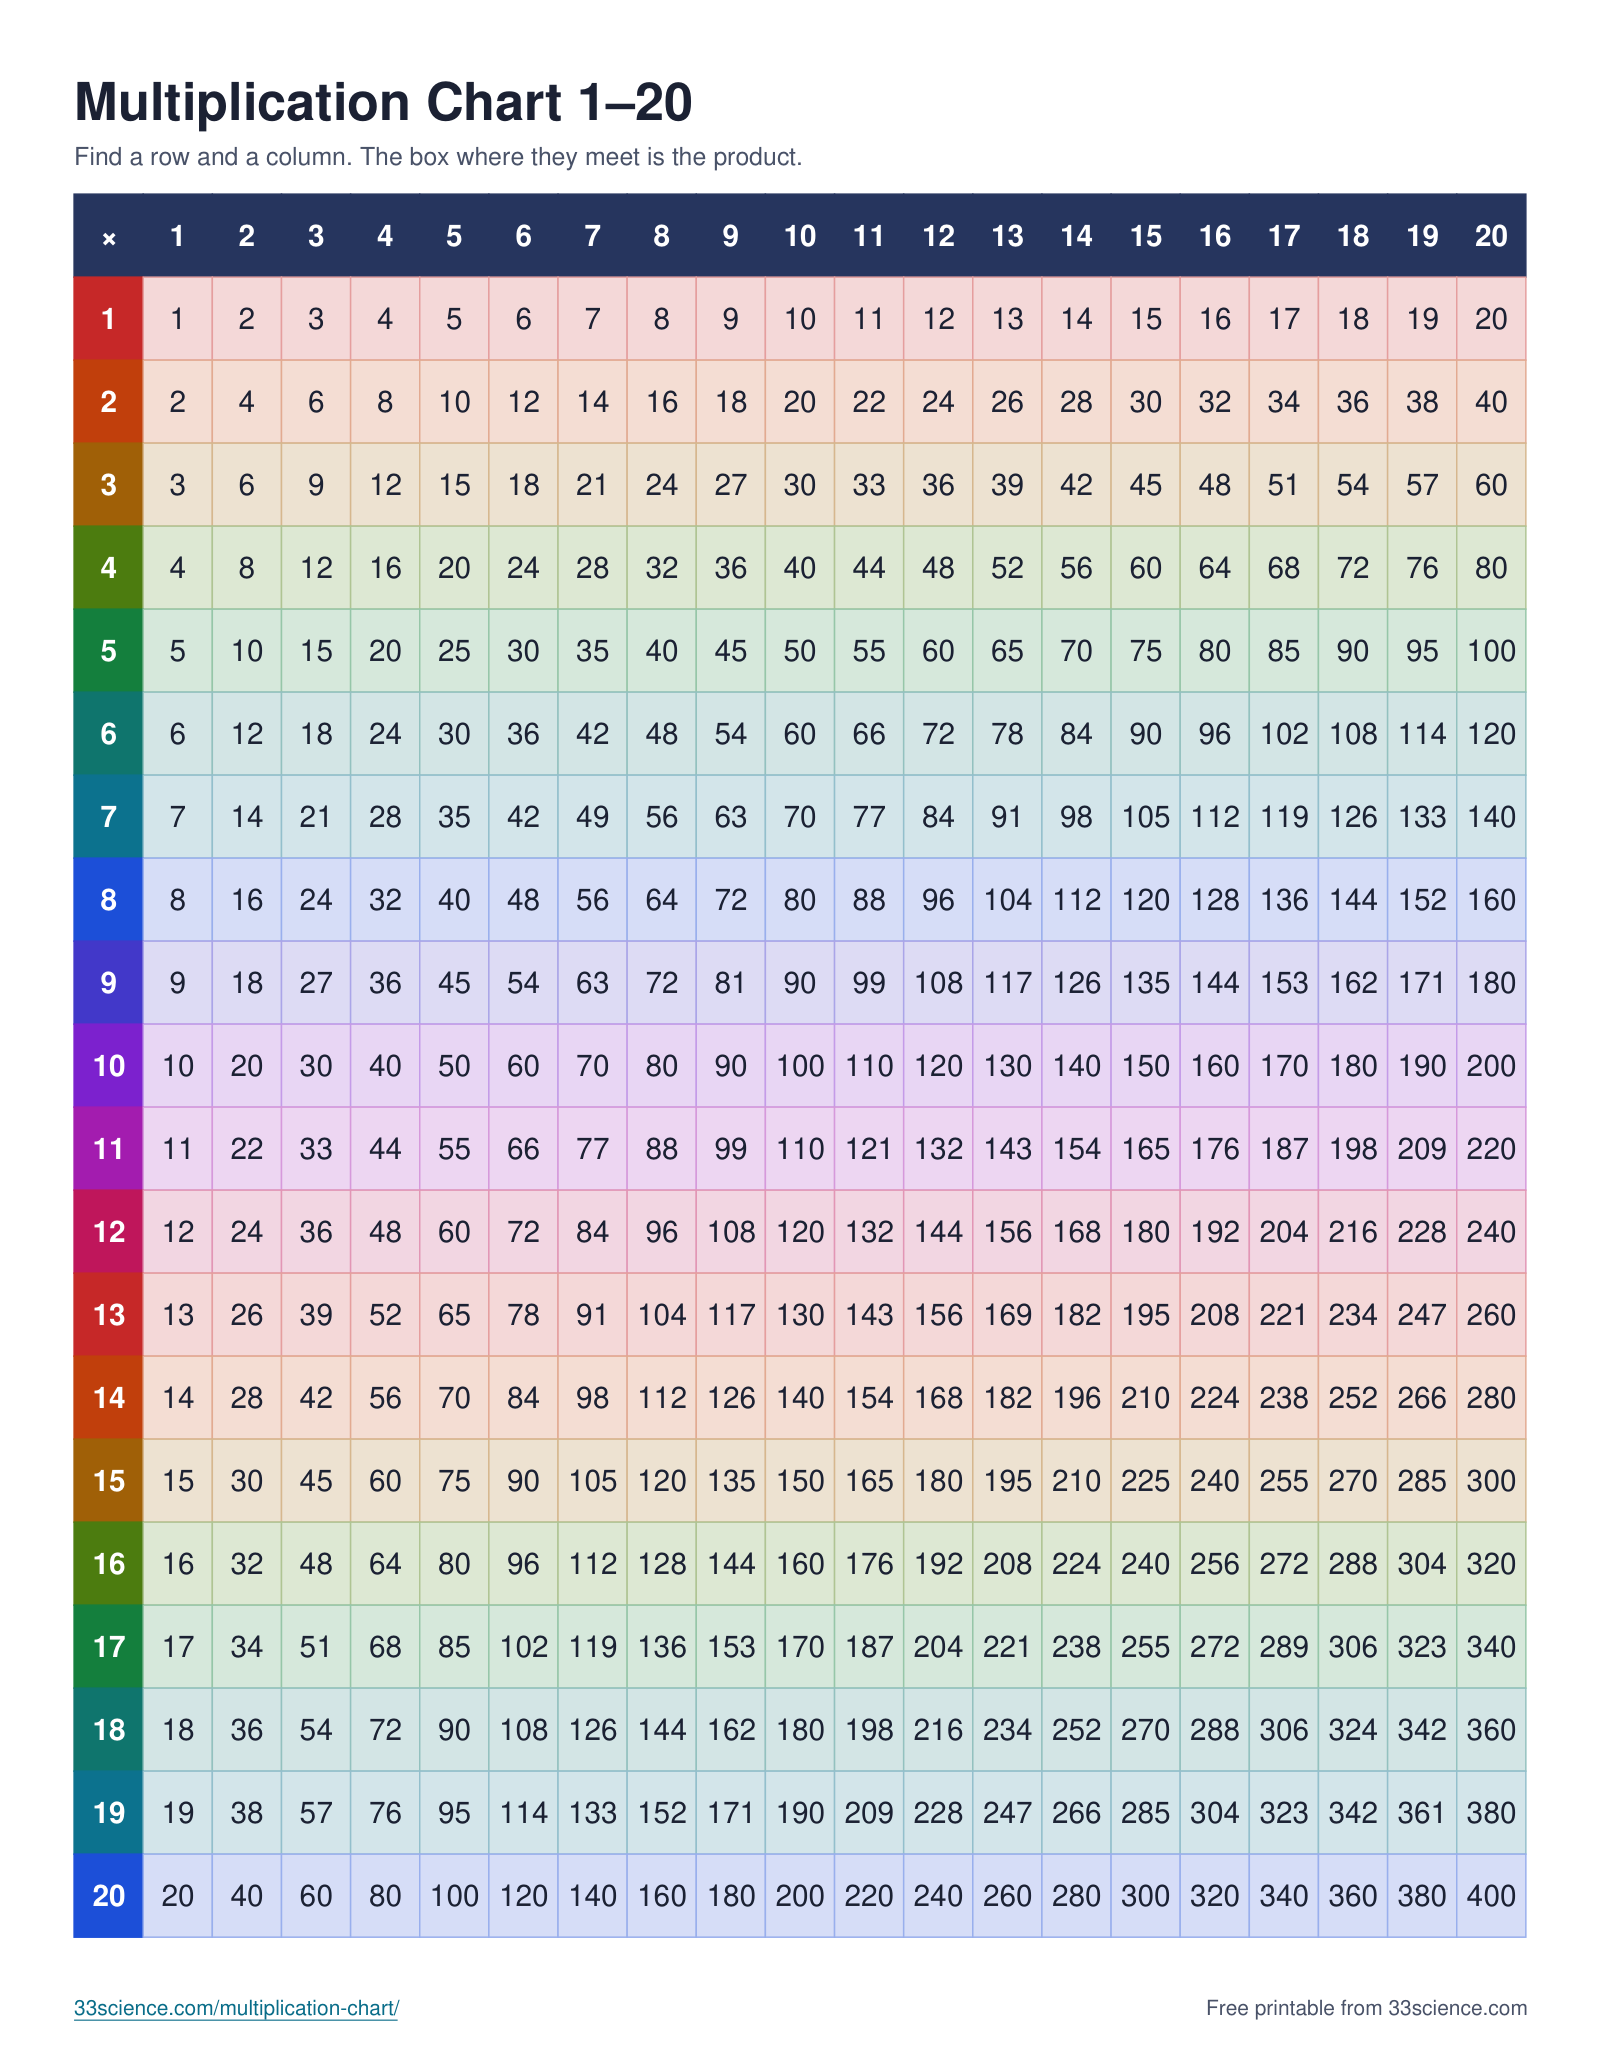
Multiplication chart 1-20
US Letter · 1 page · 8 KB · PDF
Rows and columns from 1 to 20, with products up to 400.
PNG imageDownload1600 x 2071 px · 284 KB
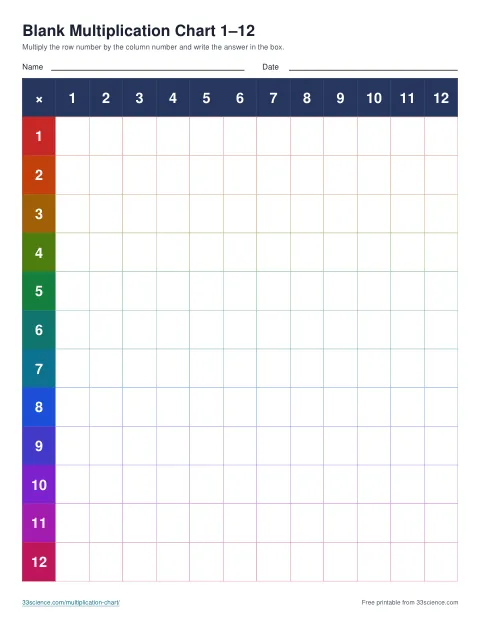
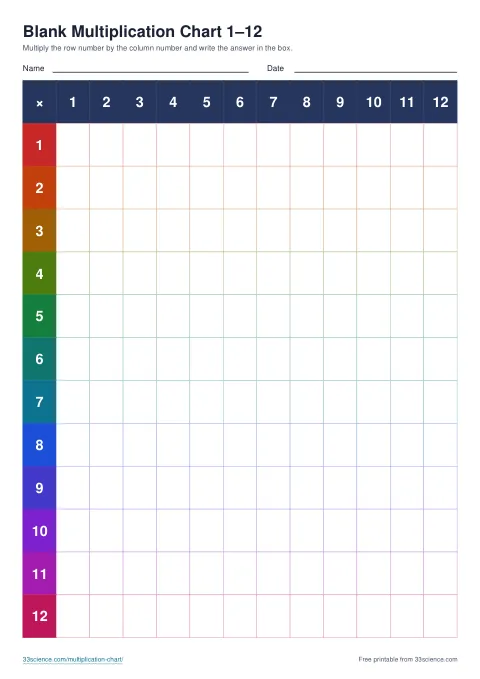
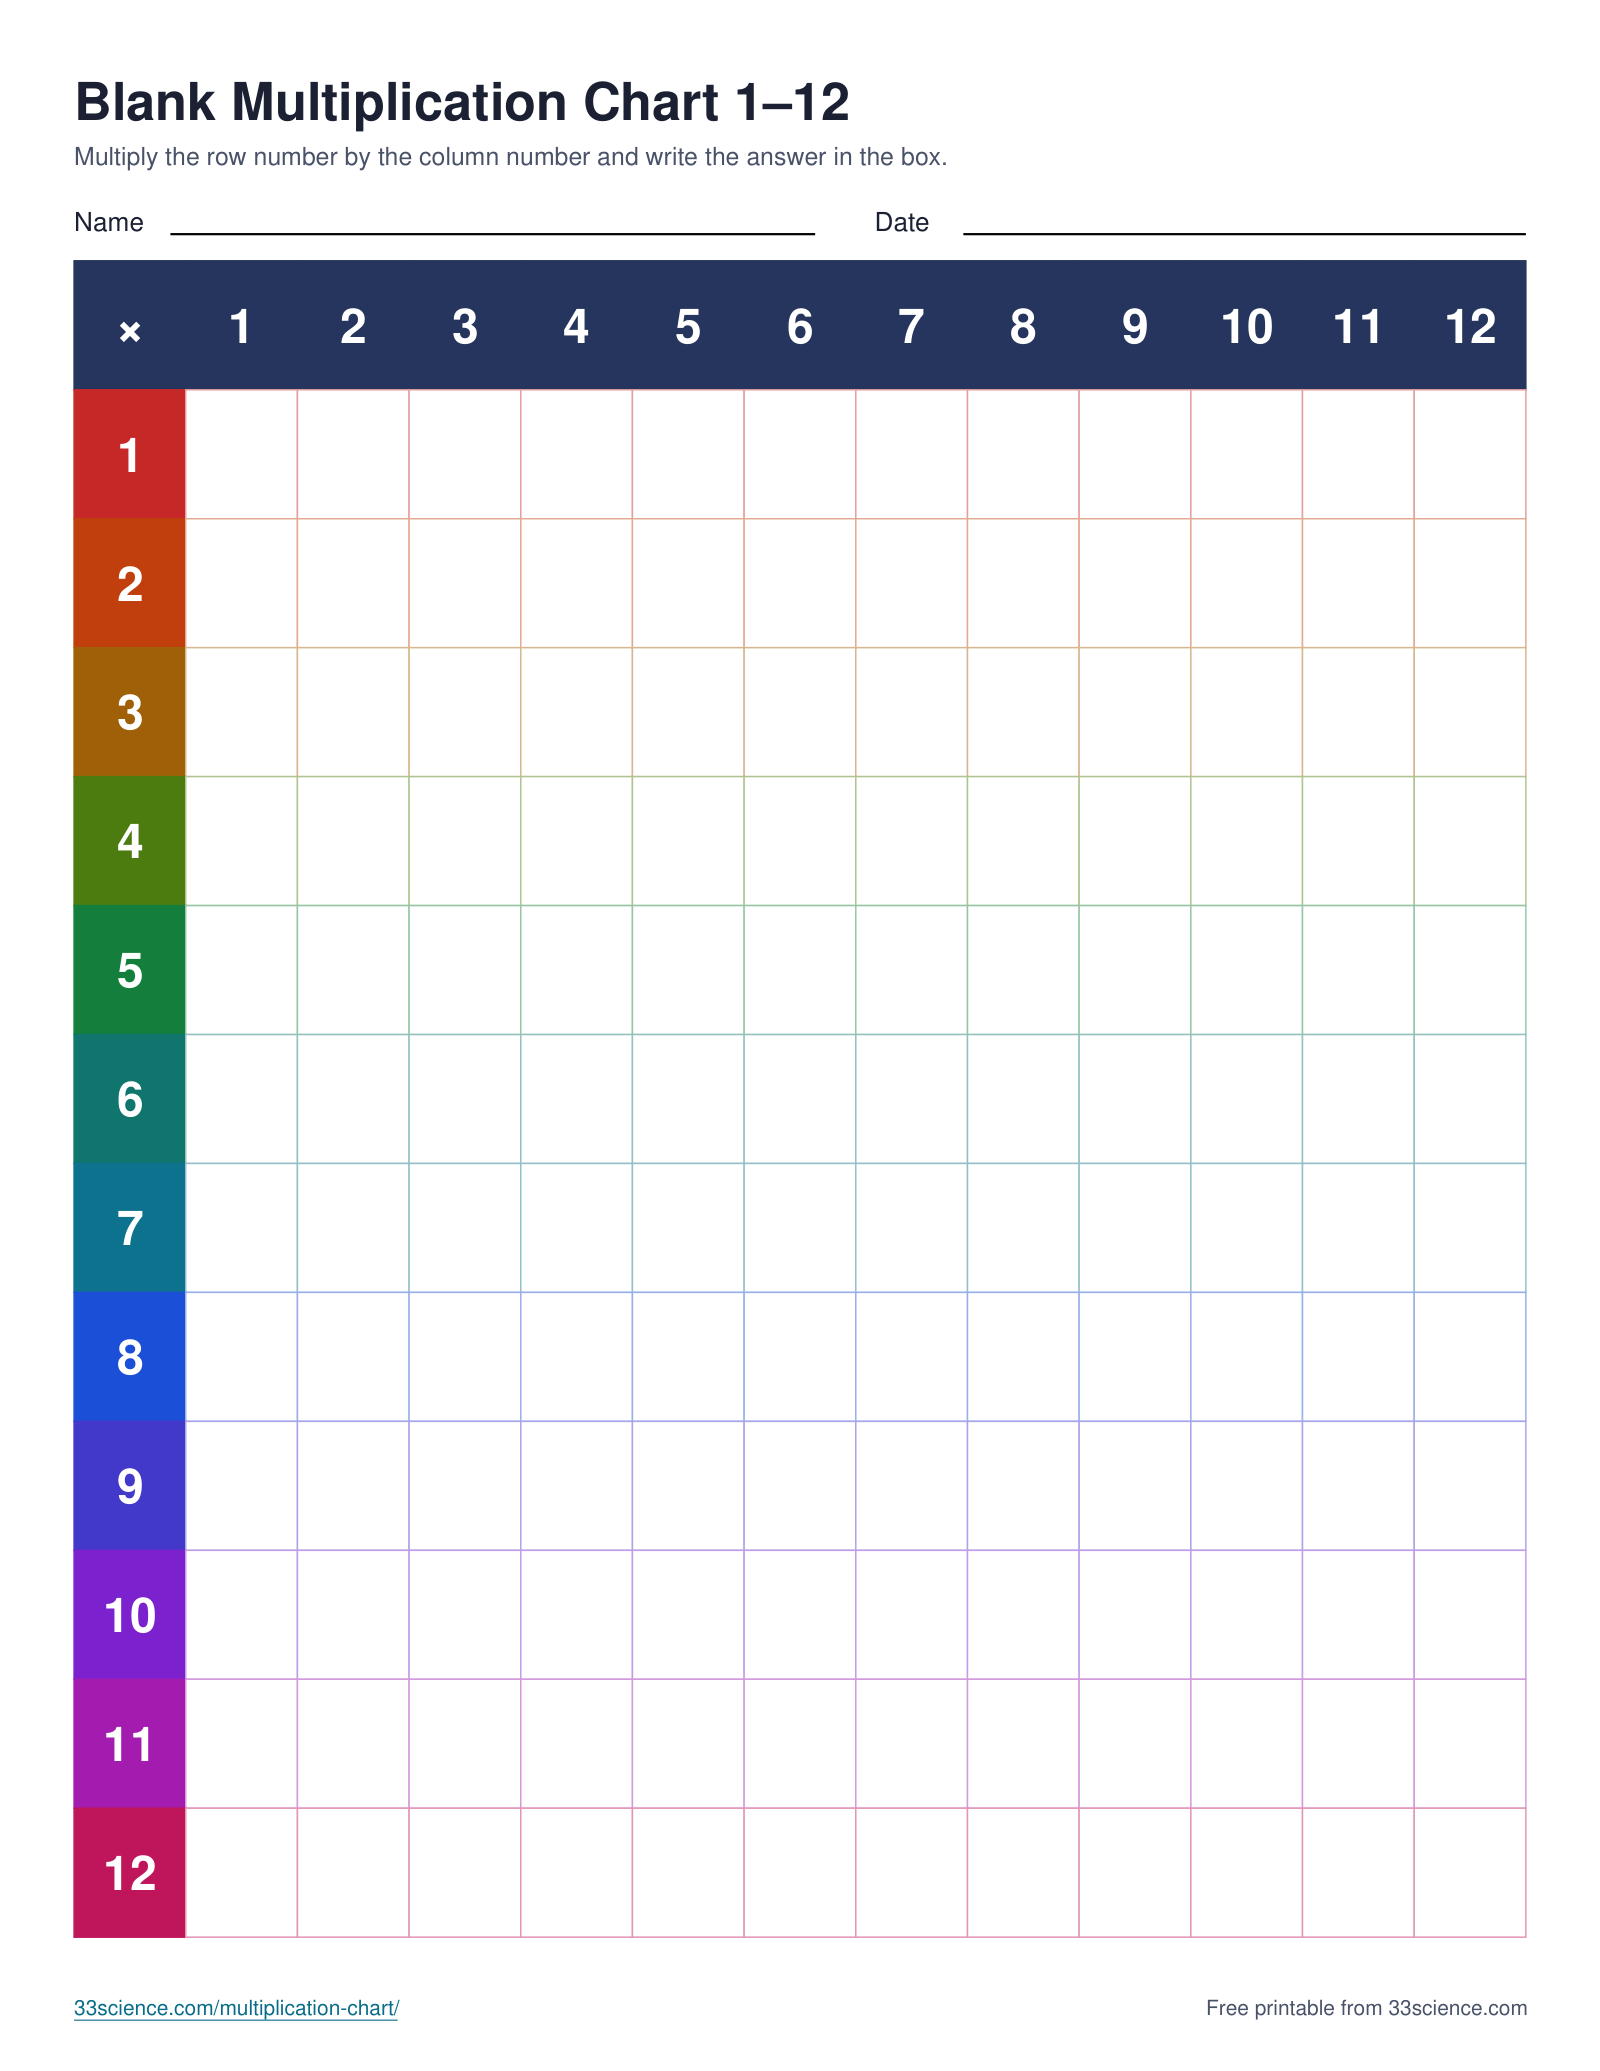
Blank multiplication chart 1-12
US Letter · 2 pages · 7 KB · PDF
An empty 1-12 chart with Name and Date lines. The answer key is on page 2.
Answer key onlyColor PDFBlack & white PDF1 page
PNG imageDownload1600 x 2071 px · 73 KB
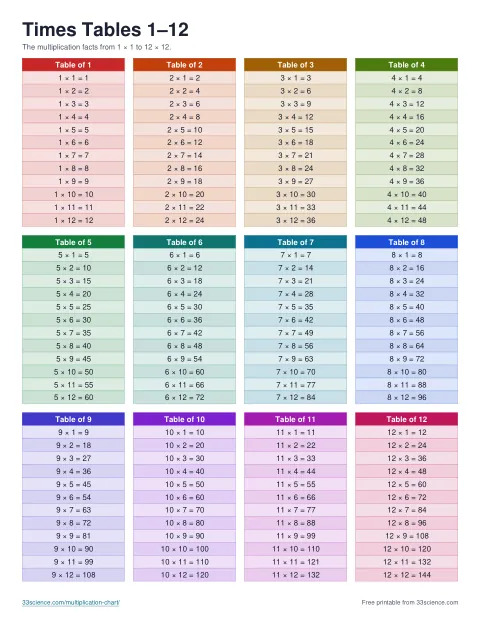
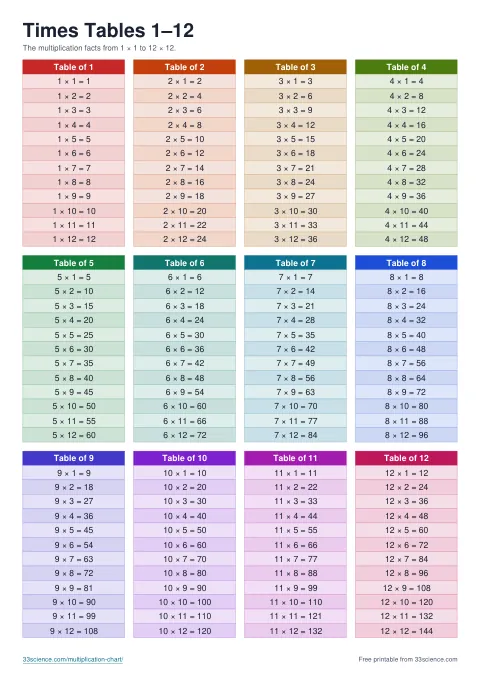
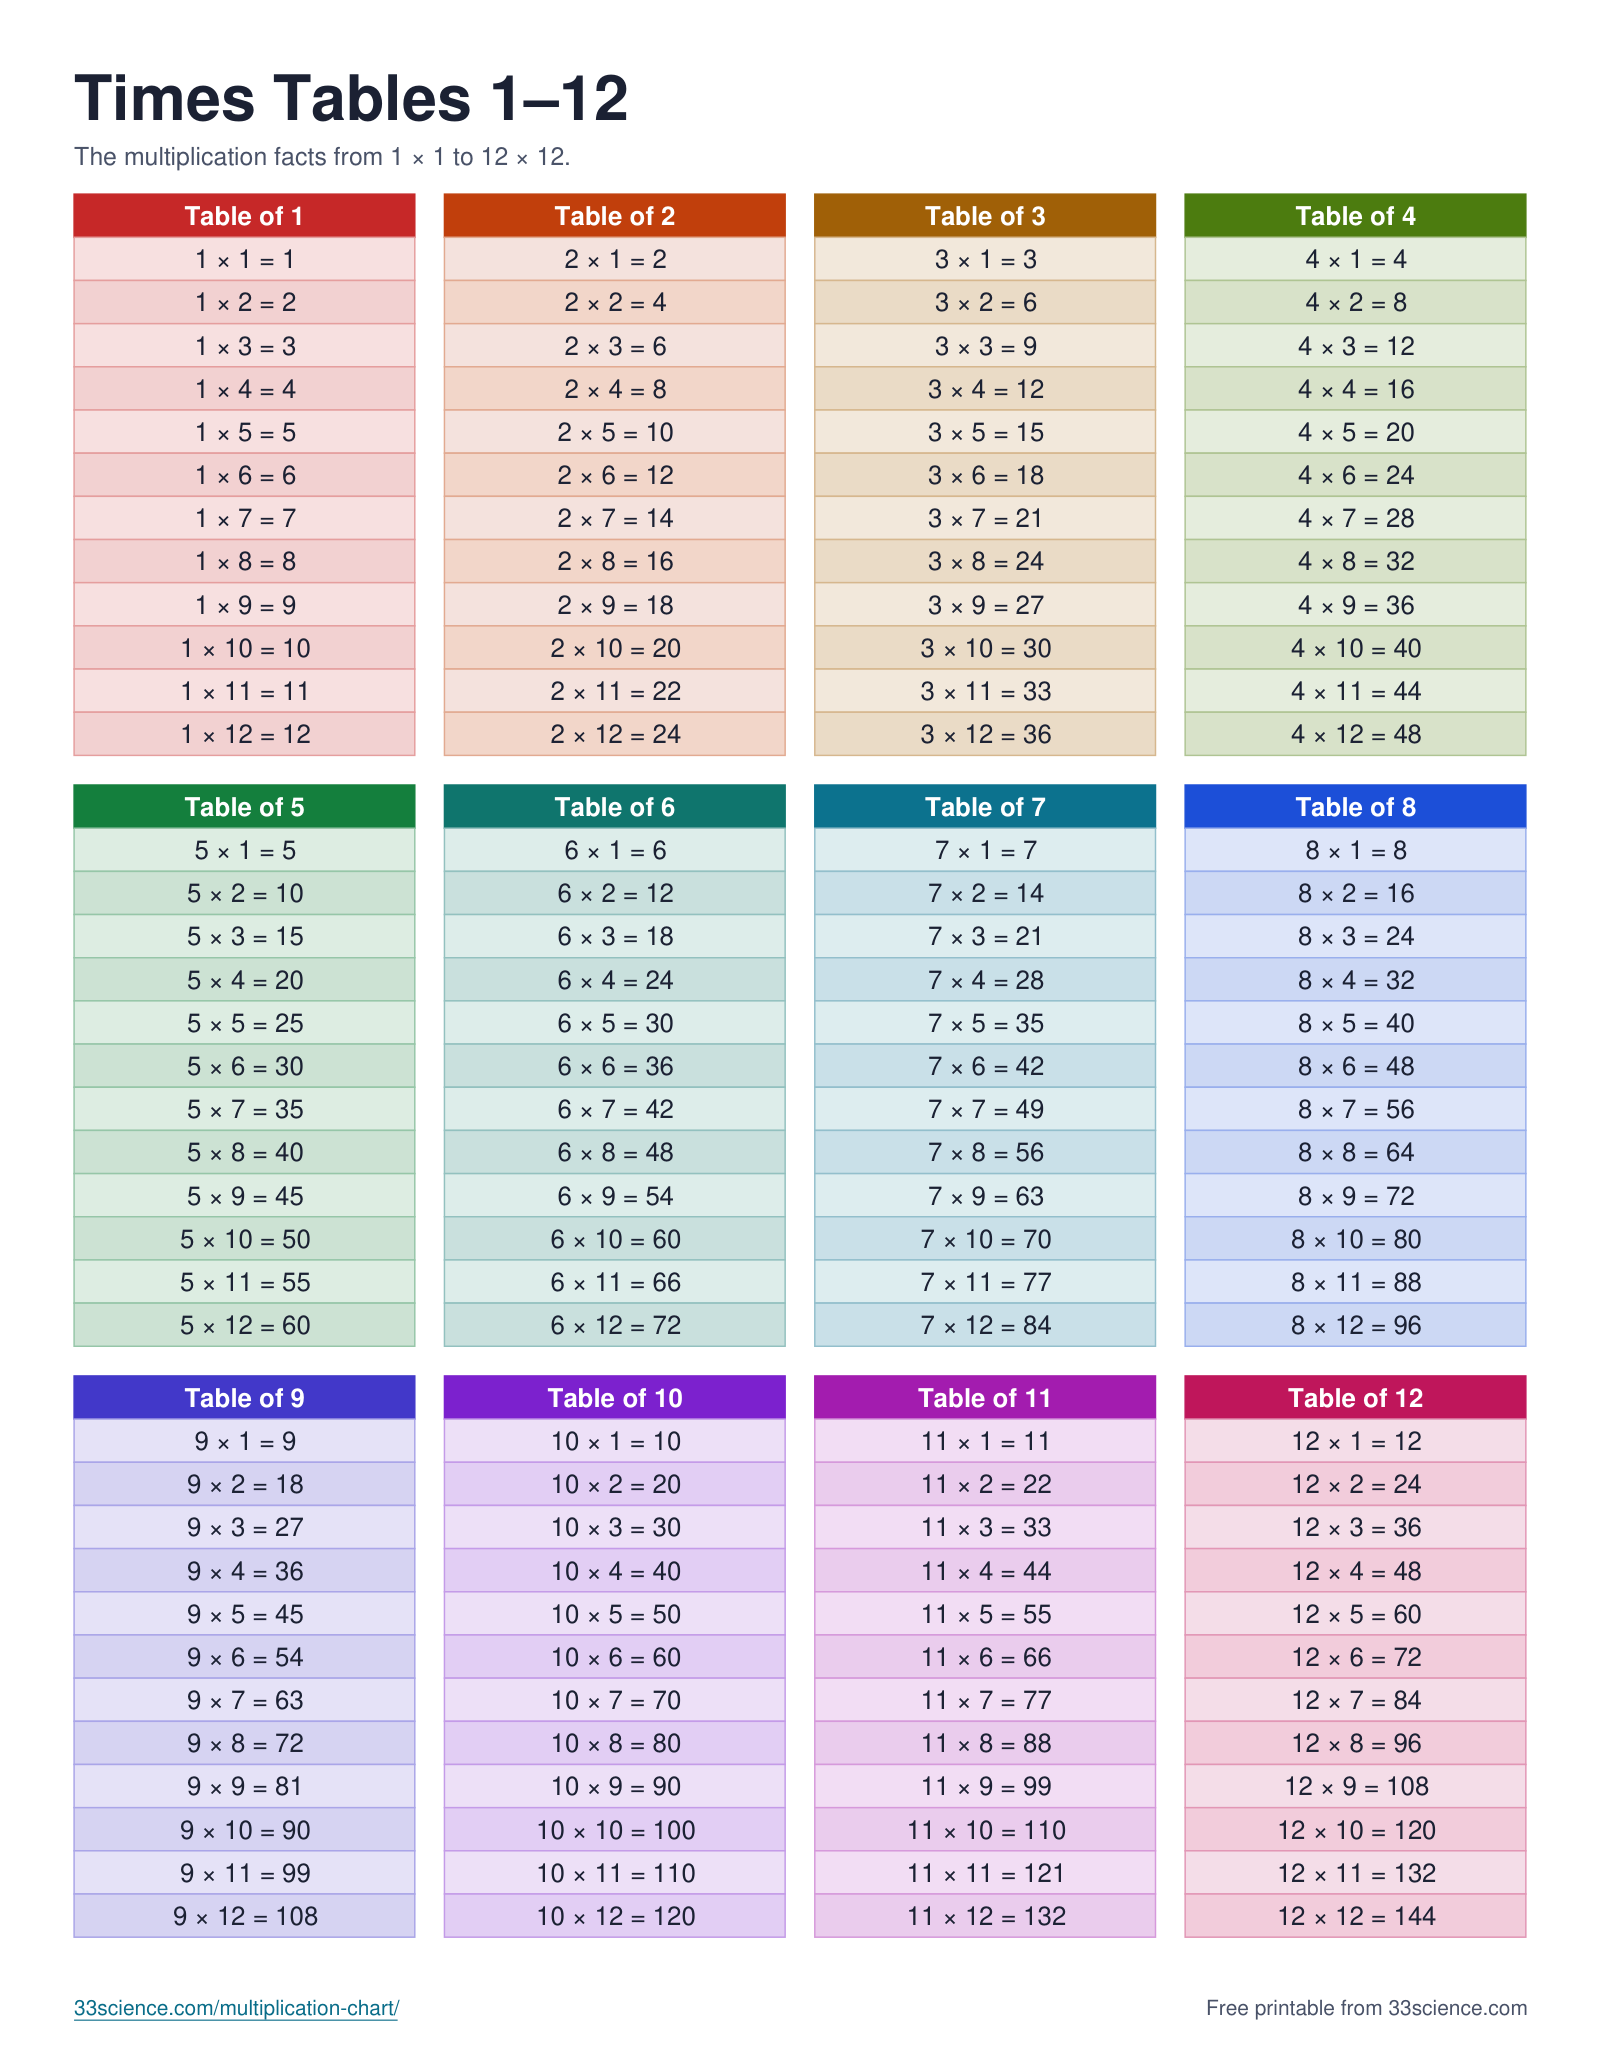
Times tables 1-12
US Letter · 1 page · 6 KB · PDF
Each times table from 1 to 12 as a large list, one per page, or all 12 on a single page.
Free for classroom and home use. Please link back if you share it online.
Need more space for your own grids? Our printable graph paper has 1/4 inch, 1 cm and coordinate plane sheets.
Help with times tables practice
A chart is a reference. These help kids practice away from the page:
- Multiplication flash cards for quick daily drills.
- A times table wall poster for a classroom or bedroom wall.
- Learning Wrap-ups for multiplication, a self-checking string game.
- Multiplication board games for family practice.
More multiplication charts
Working with fractions or decimals next? Try the mixed fraction calculator and the rounding calculator.
Frequently asked questions
What is a multiplication chart?
A multiplication chart is a grid that shows the times tables. The numbers on the top row and left column are multiplied together, and each square holds the answer for its row and column. The most common size is 1-12, which shows every product from 1 x 1 to 12 x 12.
How do you read a multiplication chart?
Find the first number in the left column and the second number in the top row. Follow the row across and the column down until they meet. The number in that square is the answer. For 6 x 7, row 6 meets column 7 at 42.
Should I use a 1-10 or a 1-12 chart?
Use 1-10 when a child is first learning, usually in grade 2 or 3. Use 1-12 after that. Most schools teach up to 12 x 12, and the multiplication tables check in England covers every table to 12.
What is a multiplication chart 1-100?
It usually means the 10 by 10 chart, which has 100 squares with products from 1 to 100. It can also mean the full chart for every number from 1 to 100, which has 10,000 products and needs 16 printed pages.
How do I make a custom multiplication chart?
Choose Custom in the generator, then enter the first and last number for the rows and for the columns, or type a list such as 3, 6, 9. Pick the answers, colors and paper size, then select Download PDF.
Is using a multiplication chart cheating?
No. A chart is a reference while the facts are being learned, the same way a word list helps with spelling. The goal is to rely on it less over time. Blank and partly blank charts help students move from looking up answers to remembering them.
At what age should kids learn the times tables?
Most children start multiplication at 7 or 8. In the US, students are expected to know all one-digit facts from memory by the end of grade 3, around age 9. In England, the 12 x 12 tables are tested in Year 4, around age 9.
What is the fastest way to memorize the times tables?
Learn the easy tables first (1, 2, 5, 10, 11), use the fact that 3 x 8 equals 8 x 3 to halve the work, and practice for 10 minutes a day with partly blank charts. Focus extra time on the few facts that are left, such as 6 x 7, 7 x 8 and 8 x 8.
How do I print the chart at full size?
Open the PDF and choose Print. Set the paper to Letter or A4 to match the file, and set scale to Actual size or 100%. Fit to page also works but leaves a wider margin.
Can I use these charts in my classroom?
Yes. The charts and PDFs are free to print and copy for classroom and home use. You can also share a link to a custom chart with your class using Copy link.