← Back to Mathematics Mathematics

Graph Paper Printable: 18 Free PDF Templates (Letter and A4)

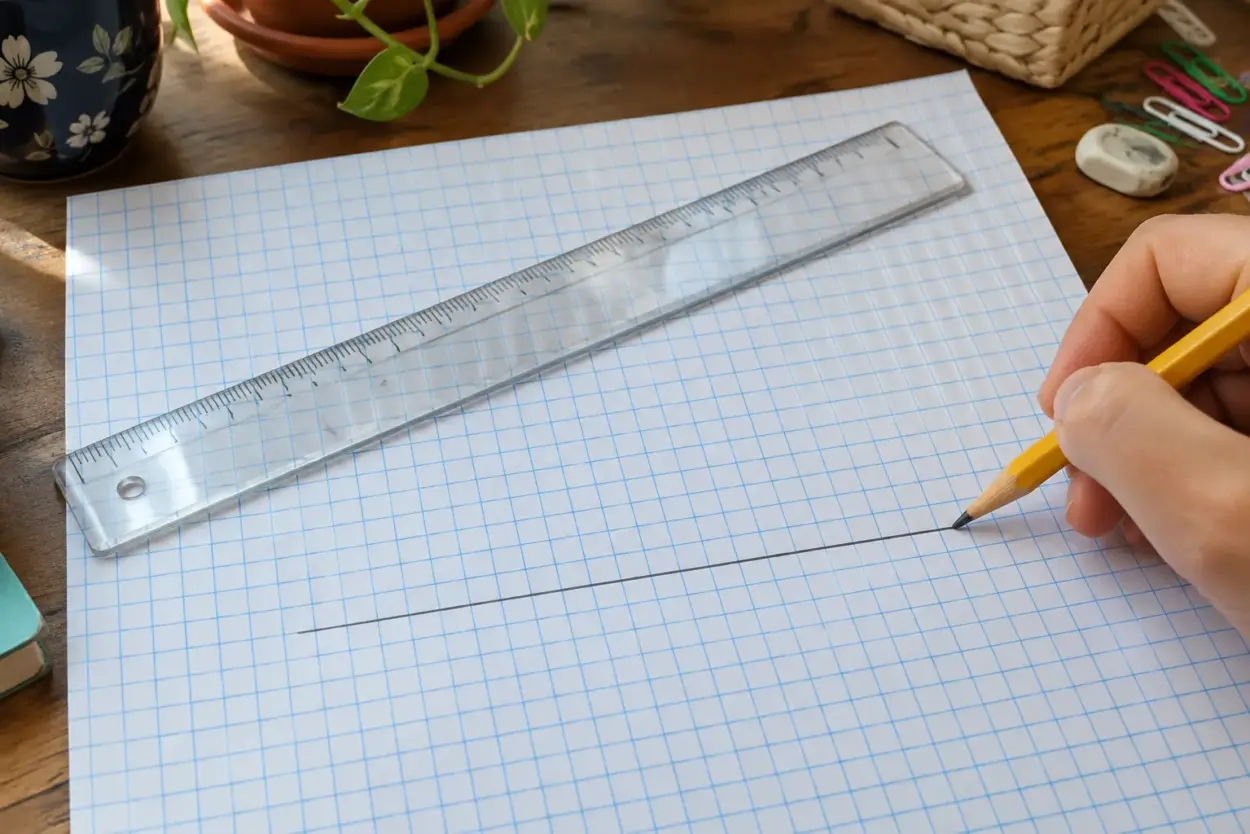
Hand drawing a pencil line on a printed sheet of blue graph paper next to a clear ruler

Short answer: Every graph paper printable on this page is a free PDF in US Letter and A4, with no sign-up. For most homework and sketching, download the 1/4 inch grid (4 squares per inch). Metric users usually want 5 mm. When you print, set the scale to Actual size or 100% so the squares come out at their true size.

There are 18 templates: eight square grids from 1 mm to 1 inch, three coordinate planes, and specialty sheets for engineering, isometric drawing, dot grids, hexagons, polar plots and semi-log data. Each one is drawn as a vector file, so the lines stay sharp at any printer resolution and a quarter inch on the file is a quarter inch on paper. The most common printing mistake is leaving “Fit to page” switched on, which shrinks every square by a few percent.

Free printable graph paper (PDF)
Templates18 grids
Paper sizesUS Letter and A4
PriceFree, no sign-up
Most downloaded
1/4 inch graph paper (4 squares per inch)
5 mm and 1 cm metric grids
Coordinate plane, -10 to 10
Print settings
Paper size matching the file
Scale: Actual size or 100%
“Fit to page” turned off

This article contains Amazon affiliate links. 33science earns a commission on qualifying purchases. See our affiliate disclosure.

Square grid graph paper (1/4 inch, 1/5 inch, 1 cm, 1 mm)

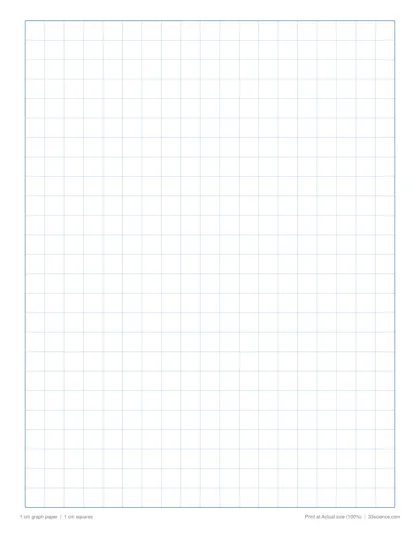
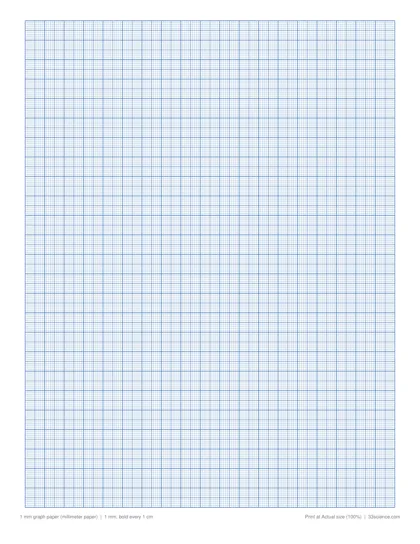
Square grid paper, also called quad-ruled or quadrille paper, is the sheet most people mean by “graph paper”. The inch grids have a darker line every inch so you can count large distances without counting every small square. The 1 mm sheet adds a medium line every 5 mm and a bold line every centimeter, the layout of classic millimeter paper.
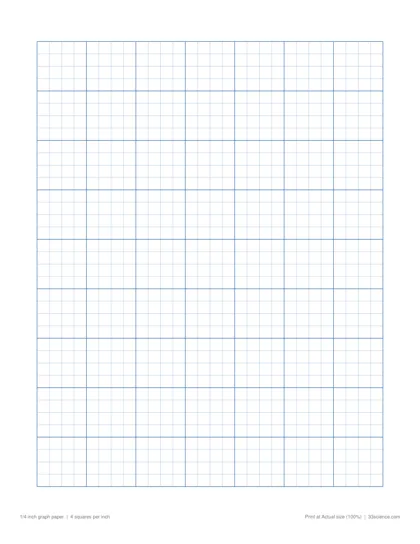
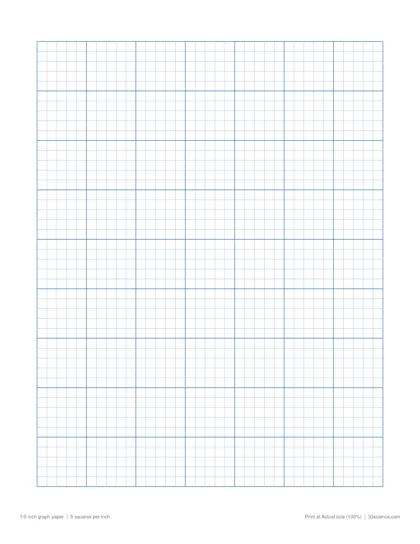
1/4 inch graph paper preview
1/4 inch
4 squares per inch, bold line every inch. The standard school grid.
1/5 inch graph paper preview
1/5 inch
5 squares per inch, bold line every inch. Easy decimal counting.
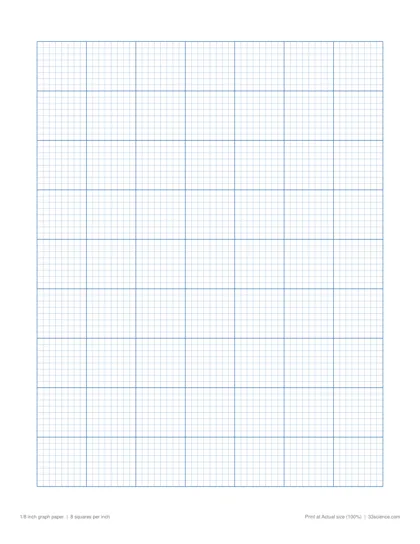
1/8 inch graph paper preview
1/8 inch
8 squares per inch. Small handwriting, detailed plans.
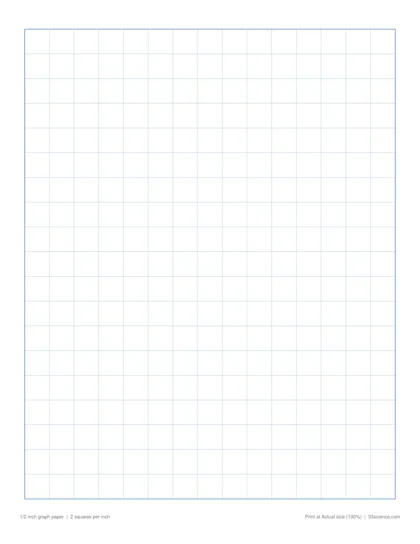
1/2 inch graph paper preview
1/2 inch
2 squares per inch. Young kids, big numbers.
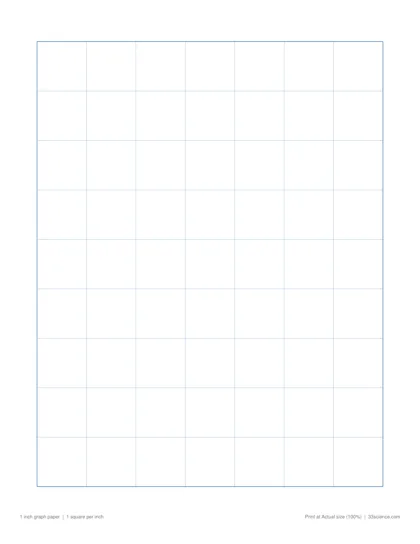
1 inch graph paper preview
1 inch
1 square per inch. Kindergarten, area models, games.
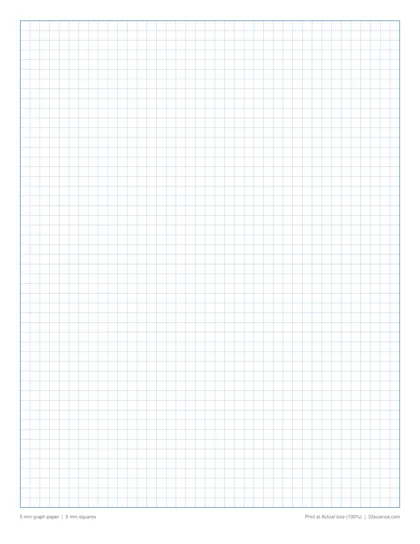
5 mm graph paper preview
5 mm
5 mm squares. The metric everyday grid.
1 cm graph paper preview
1 cm
1 cm squares. Elementary math, area and perimeter.
1 mm graph paper (millimeter paper) preview
1 mm (millimeter)
1 mm squares, bold every 5 mm and 1 cm. Precise lab plots.

Every grid fills the page edge to edge in whole squares, with a margin of at least 0.4 inch that home printers can reach. Lines are light blue with darker major lines, which reads well on screen and prints as clean gray on a black-and-white printer.

Coordinate plane graph paper

Coordinate plane sheets come with the x and y axes already drawn and numbered, which saves the first five minutes of every graphing assignment. Use the single large plane for one detailed graph, the four-per-page sheet for a set of homework problems, and the first-quadrant sheet when all your values are positive, such as plotting science lab data against time.
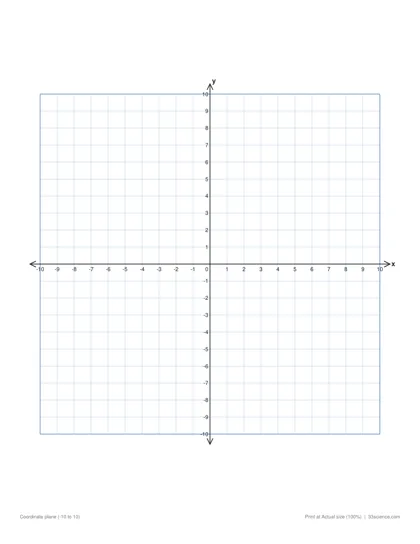
Coordinate plane (-10 to 10) preview
Coordinate plane
One large four-quadrant plane, numbered -10 to 10.
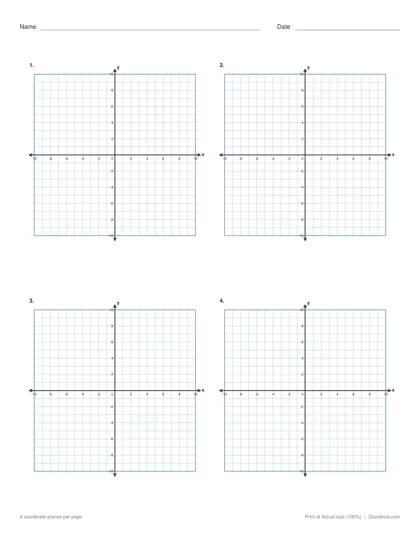
4 coordinate planes per page preview
4 planes per page
Four numbered planes with a name line. Homework sets.
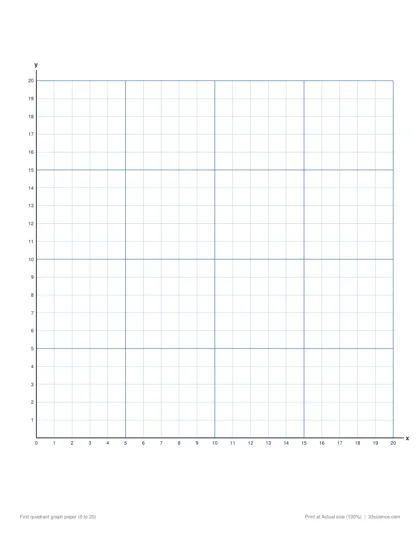
First quadrant graph paper (0 to 20) preview
First quadrant
Positive x and y, numbered 0 to 20. Line graphs and data.
Tip
Plotting lab data? Choose a scale that makes your data fill at least half the grid in both directions. A graph squeezed into one corner hides the trend you are trying to show.

Specialty graph paper: isometric, polar, semi-log and more

Specialty grids solve one job each. Pick the sheet by what you are drawing:

Engineering paper
5 squares per inch, green
Used for engineering and physics problem sets. The pale green grid keeps hand-written work readable, and the header holds your name, date and page number.
Isometric paper
Lines and dots
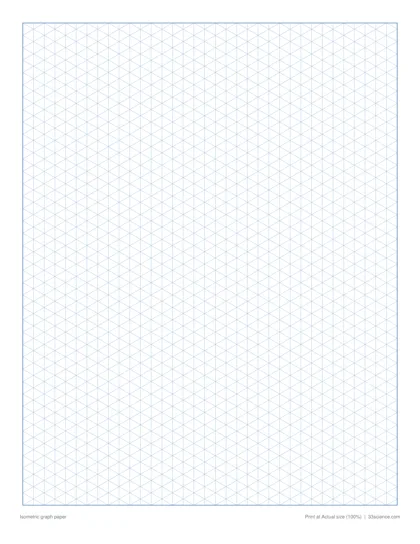
Lines run vertically and at 30 degrees either side, forming equilateral triangles. Follow them to draw cubes, block structures and objects in 3D without measuring angles.
Polar graph paper
Circles and spokes
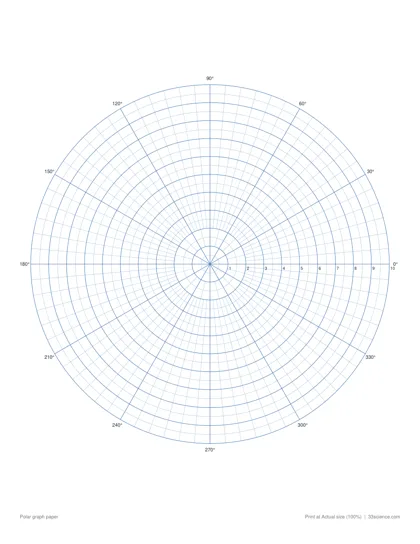
Concentric circles mark the distance r and spokes every 5 degrees mark the angle. Use it for polar equations like roses and spirals, and for compass bearings.
Semi-log paper
3 cycles
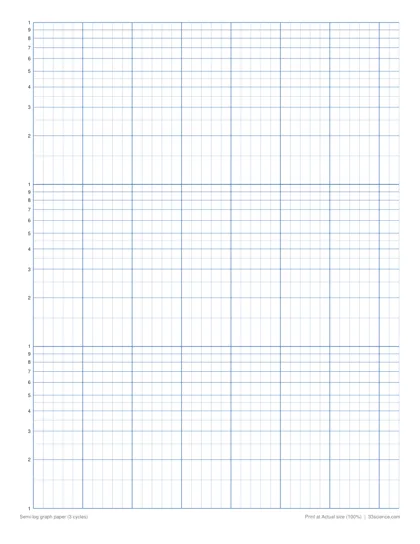
The y axis is logarithmic and covers three powers of ten. Exponential growth or decay, such as bacterial growth or radioactive decay, plots as a straight line.
Hexagon paper
Flat-top hexagons
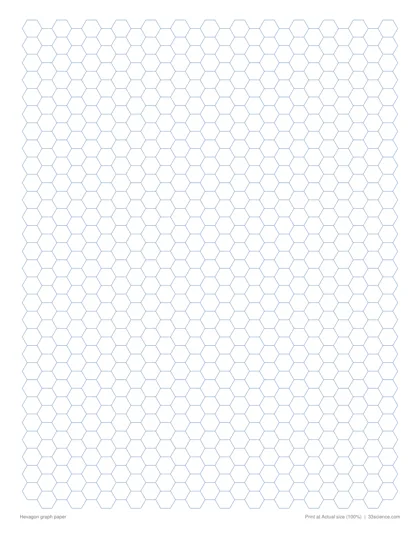
Handy for drawing benzene and other ring structures in organic chemistry, and for game maps.
Dot grid paper
5 mm
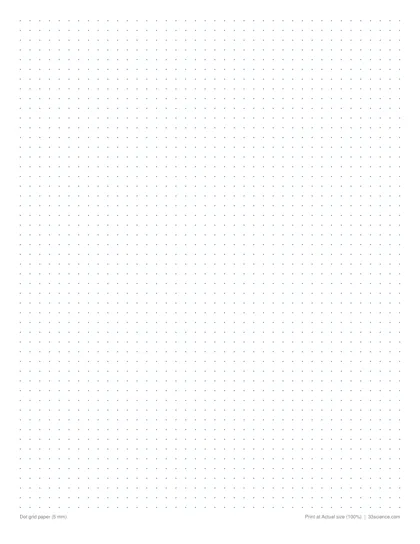
Dots instead of lines give you guides that disappear under your drawing. Popular for bullet journals, diagrams and lettering practice.

Download the specialty sheets here, each in both paper sizes:
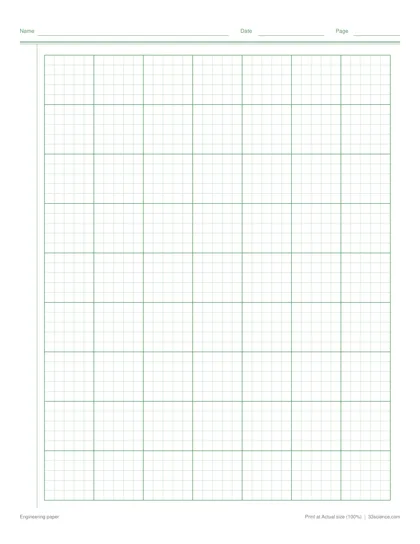
Engineering paper preview
Engineering paper
5 squares per inch in pale green, header for name, date and page.
Isometric graph paper preview
Isometric
Vertical and 30 degree lines. 3D drawings of blocks and objects.
Isometric dot paper preview
Isometric dots
Dots on a triangle lattice. Lighter 3D sketching.
Polar graph paper preview
Polar
Concentric circles with 5 degree spokes. Polar equations.
Semi-log graph paper (3 cycles) preview
Semi-log
Log scale over 3 cycles on y, linear x. Growth and decay data.
Hexagon graph paper preview
Hexagon
Flat-top hexagons. Organic chemistry rings, game maps.
Dot grid paper (5 mm) preview
Dot grid
5 mm dots. Bullet journals, sketches, diagrams.
Good to know
Each semi-log cycle covers one factor of ten (1 to 10, 10 to 100, 100 to 1,000). Count how many powers of ten your data spans and make sure the sheet has at least that many cycles. Label the first cycle 1, 10 or 0.1 to match your smallest value.

Which graph paper size should you use?

Use 1/4 inch for general math and science work, larger squares for young children and smaller squares when you need detail. The square size should match the smallest thing you need to draw or write in a single box.

GridSquare sizeBest for
1 inch25.4 mmKindergarten, counting, board games
1/2 inch12.7 mmEarly elementary, large handwriting, bar graphs
1 cm10 mmArea and perimeter, base-ten blocks, multiplication arrays
1/4 inch6.35 mmAlgebra graphs, science lab charts, floor plans, general use
1/5 inch5.08 mmEngineering and physics work, scale drawings in tenths
5 mm5 mmMetric homework, notes, sketching
1/8 inch3.18 mmSmall handwriting, detailed plans, pixel art
1 mm1 mmPrecise plots, technical drawing, measuring from a graph

For floor plans, 1/4 inch makes a simple scale: one square equals one foot. Cross-stitch and knitting charts work on 1/8 inch or 5 mm, where one square is one stitch. If you go through a lot of sheets, a pad of quad-ruled paper costs less than printer ink, and an engineering computation pad has the grid printed on the back so it shows faintly through the front.

Print at Actual size (100%) with the paper size set to match the file. Most PDF viewers default to “Fit” or “Shrink oversized pages”, which scales the whole sheet down by 3 to 6 percent. That is invisible on a single square but adds up to a quarter inch or more across the page, which matters for scale drawings.
Download the file for your paper.
Choose Letter in the US and Canada and A4 almost everywhere else. A Letter file printed on A4 paper, or the reverse, gets scaled or cropped.
Open it in a PDF viewer.
Adobe Acrobat Reader, your browser and the Preview app all work. Use the viewer’s Print command rather than a screenshot.
Set the scale to Actual size.
In Acrobat this is Page Sizing and Handling, then Actual size. In Chrome and Edge, open More settings and set Scale to 100 or Default. Turn off “Fit to page” or “Shrink to fit”.
Print one test page.
Plain printer paper is fine. Heavier 24 lb or 90 gsm paper takes erasing better if you plan to draw and redraw.
Check the squares with a ruler.
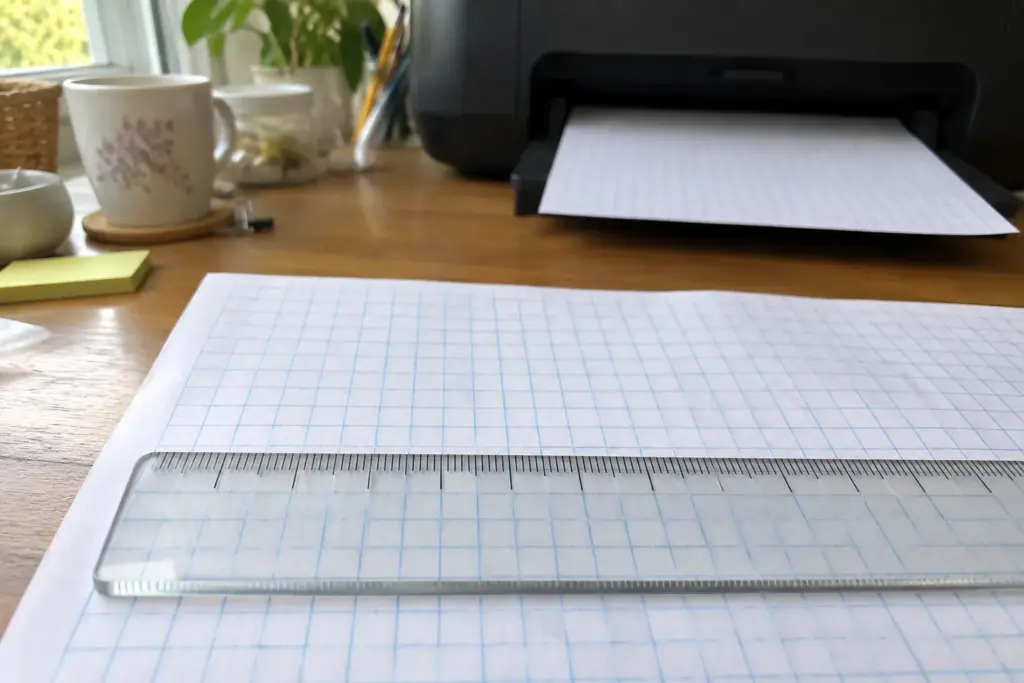
On the 1/4 inch sheet, the bold lines should be exactly 1 inch apart. On the 1 cm sheet, ten squares should measure 10 cm. If they come out short, a scaling setting is still on.
Clear ruler laid across printed graph paper to check the square size, with a printer in the background
A ruler check takes ten seconds and confirms the printer did not scale the page.
Careful
Some printer drivers apply their own scaling even when the PDF viewer says 100%. If the ruler check fails, open the printer’s Preferences or Properties and turn off any “Fit to page”, “Borderless” or “Scale” option there too.

Frequently asked questions

What is the most common graph paper size?

The most common grid is 1/4 inch, or 4 squares per inch, printed on US Letter paper. Outside North America the usual choice is a 5 mm grid on A4.

Is this printable graph paper really free?

Yes. All 18 PDF templates download directly with no account, email or watermark, and you can print as many copies as you need for home or classroom use.

Why are my printed squares smaller than they should be?

The print dialog is scaling the page to fit the printable area. Set the scale to Actual size or 100 percent and turn off any fit or shrink option in both the PDF viewer and the printer settings.

What is the difference between graph paper and grid paper?

They are the same thing. Graph paper, grid paper, quad-ruled paper and quadrille paper all describe a sheet printed with a regular grid of squares.

How many squares per inch is engineering paper?

Engineering paper normally has 5 squares per inch, with a darker line every inch. It is printed in pale green with a header for the name, date and page number.

Can I print graph paper on A4 paper?

Yes. Download the A4 version of the sheet so it fits the page without scaling. Printing a Letter file on A4 paper either shrinks the grid or cuts off the bottom rows.

What is isometric graph paper used for?

Isometric paper is used to draw three-dimensional objects such as cubes and block structures. Its lines run at 30 degrees either side of vertical, so the three visible faces of a cube line up with the grid.

What kind of graph paper do I need for exponential data?

Use semi-log paper, which has a logarithmic y axis and a linear x axis. Exponential growth or decay appears as a straight line, and the slope gives the rate.

Sources

Avatar photo

Prof. Daniel Kowalski

Professor of Applied Mathematics with a joint appointment in Computer Science, currently on leave to focus on science communication. Published extensively on machine learning theory before discovering he enjoyed explaining algorithms to non-specialists more than optimizing them. Runs a popular video series on the mathematics hiding in everyday life. Believes that math anxiety is a bigger barrier to science literacy than any equation.

Post navigation