
Quick Answer
China refined an estimated 2,000 metric tons of selenium in 2025, more than half of global output outside the United States (which withholds its own numbers). Japan (640 tons) and Russia (320 tons) trail a distant second and third. But rank the countries by selenium reserves instead of production, and Russia jumps to first with 26,000 tons, followed by Peru — China barely cracks the top five. That gap between who mines it and who’s sitting on it is the whole story of this metal.
Table of Contents
- Mined, Not Mined: Why “Selenium Production” Is a Trick Question
- The Top Selenium-Producing Countries in 2025
- Why China Refines More Selenium Than Almost Everyone Else Combined
- Selenium Reserves Tell a Completely Different Story
- The Trend: Prices Are Climbing While Output Barely Moves
- What All This Selenium Actually Goes Into
- Why a Metal Nobody Thinks About Still Matters
Mined, Not Mined: Why “Selenium Production” Is a Trick Question
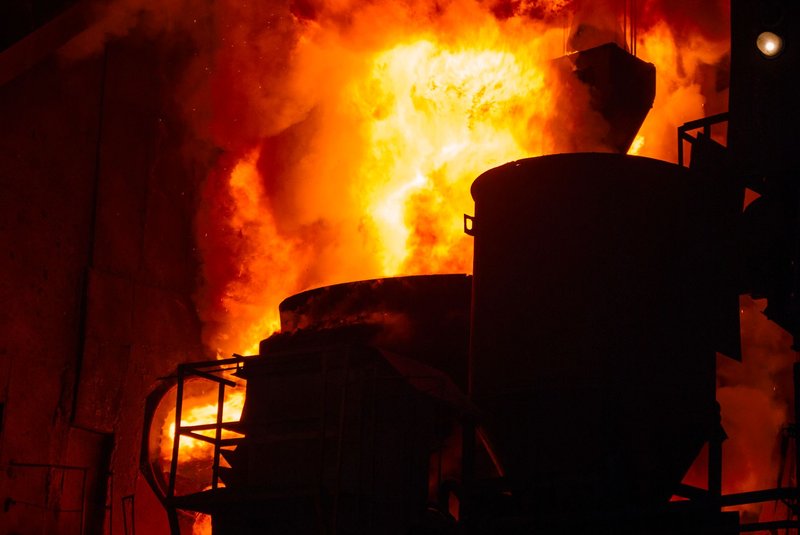
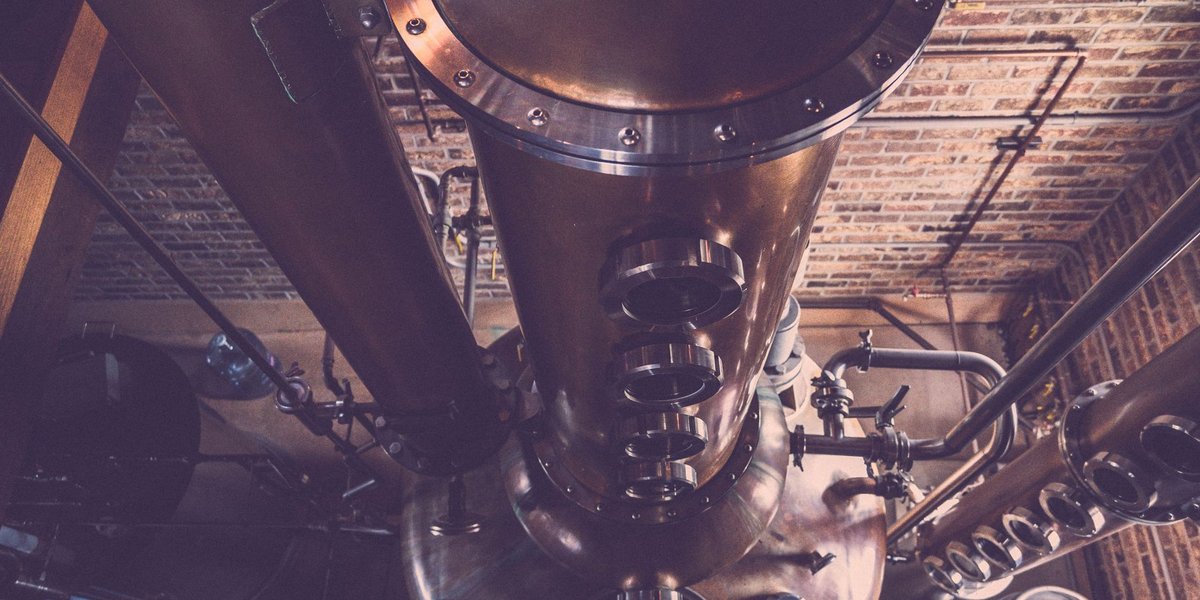
Nobody digs a selenium mine. There’s no selenium ore body worth chasing on its own — the element is too diffuse and too cheap relative to the cost of extracting it directly. Instead, selenium shows up as a hitchhiker in copper ore, and it gets recovered during the electrolytic refining stage, when raw copper is purified into the high-grade metal used in wiring and plumbing. The selenium concentrates in a sludge called anode slime, left behind at the bottom of the refining tanks, and gets skimmed off and processed separately.
That’s why the U.S. Geological Survey reports selenium figures as “refinery production,” not “mine production.” It’s also why the two older reference pages that dominate this search — one running 2018-2019 figures, the other citing 2009 USGS data — miss the more useful distinction entirely: a country can refine a lot of selenium without mining any copper of its own, if it’s importing anode slime or crude selenium from elsewhere and finishing the purification domestically. Refining capacity, not mineral wealth, is the bottleneck.
The Top Selenium-Producing Countries in 2025

Here’s the ranked table, built from the USGS Mineral Commodity Summaries published in February 2026, covering estimated 2025 refinery output. The United States isn’t ranked because its own production figures are withheld to protect proprietary company data — it still runs two primary electrolytic copper refineries, one in Texas and one in Utah, but nothing about their selenium output gets disclosed publicly.
| Rank | Country | 2025 Refined Selenium (metric tons) | Share of World Total |
|---|---|---|---|
| 1 | China | 2,000 | 53% |
| 2 | Japan | 640 | 17% |
| 3 | Russia | 320 | 8% |
| 4 | Belgium | 200 | 5% |
| 5 | Canada | 130 | 3% |
| 6 | India | 90 | 2% |
| 7 | Mexico | 88 | 2% |
| 8 | Serbia | 71 | 2% |
| 9 | Poland | 67 | 2% |
| 10 | Kazakhstan | 50 | 1% |
| 11 | Peru | 48 | 1% |
| 12 | Germany | 47 | 1% |
| 13 | Turkey | 43 | 1% |
| 14 | Finland | 39 | 1% |
| 15 | South Africa | 10 | <1% |
| 16 | Uzbekistan | 2 | <1% |
World total is 3,800 metric tons, rounded, and excludes withheld U.S. production.
Kazakhstan is the newest name on this list. Its first shipment of refined selenium left a newly completed plant in January 2025, with the facility rated to produce roughly 75 tons a year at 99.5% purity once it ramps to capacity — it hasn’t gotten there yet, but it’s already outranked Peru and Germany in its debut year.
Worth a flag for anyone cross-checking against older USGS editions: Finland’s 2024 figure was revised down hard, from an initially reported 170 tons to a corrected 38, and India’s went the opposite direction, from 14 tons to 88, after both governments supplied better company-level data. Selenium byproduct accounting is genuinely messy, which is part of why so few sources bother getting it right.
Why China Refines More Selenium Than Almost Everyone Else Combined
China’s selenium output didn’t grow because someone found a selenium deposit. It grew because China’s electrolytic copper refining capacity increased by roughly 75% over the past decade, and its copper anode production — the actual feedstock that carries the selenium — more than doubled over the same stretch. Selenium output rode along for the increase almost by accident, as a captured byproduct of a much bigger industrial buildout aimed at copper, not at selenium at all.
That’s the mechanism behind every number on this list. A country’s selenium rank tracks its copper-refining footprint, full stop. Japan’s second-place finish reflects a mature electrolytic copper industry, not a selenium strategy. Russia’s output ties to its long-established copper-nickel refining base. None of these countries are optimizing for selenium — they’re optimizing for copper, and selenium is the leftover that happens to have its own market.
Selenium Reserves Tell a Completely Different Story
Production and reserves get treated as interchangeable in most of the coverage of this topic, and they shouldn’t be. The most recent USGS reserves estimate — published in the January 2025 edition, since the 2026 update didn’t include a fresh reserves table — put global selenium reserves at 92,000 metric tons, and the ranking looks nothing like the production list above.
| Country | Selenium Reserves (metric tons) |
|---|---|
| Russia | 26,000 |
| Peru | 16,000 |
| United States | 10,000 |
| Canada | 6,500 |
| China | 5,000 |
| Poland | 3,000 |
| India | 500 |
| Sweden | 500 |
| Finland | 300 |
| Rest of world | 24,000 |
Russia and Peru, both mid-pack or worse on annual output, hold the two largest reserve bases by a wide margin. China, the production leader, ranks fifth. The reason is methodological as much as geological: for every country except China, USGS estimates reserves as the selenium content locked inside existing copper reserves — a proxy figure, not a direct assay. China is the one exception, reporting selenium reserves directly to its government surveyors. So the two numbers aren’t purely comparing rock to rock; they’re comparing an estimation method to a self-reported one. Either way, it means Russia and Peru have decades of untapped selenium sitting in ground they haven’t fully committed to refining yet, while China is extracting close to its share of what a byproduct model can realistically deliver.
The Trend: Prices Are Climbing While Output Barely Moves
World refinery production has crept up slowly: 3,530 tons in 2023, 3,700 in 2024, an estimated 3,800 in 2025. That’s not a boom — it’s roughly 4% annual growth, consistent with a metal whose supply is capped by copper refining capacity rather than by selenium demand itself.
Prices haven’t been nearly as patient. The U.S. average price hit an estimated $28 per kilogram in 2025, up from $18.18 in 2021 — a 54% jump in four years. European prices moved almost in lockstep, from $18.47 to an estimated $29 over the same period. When a byproduct metal can’t be produced faster just because buyers want more of it, rising demand shows up entirely in price, not in supply. That’s the mechanical reason selenium has gotten more expensive even as the country rankings barely reshuffled.
What All This Selenium Actually Goes Into
Metallurgy is the single biggest consumer, at an estimated 40% of global demand in 2025 — most of it going into electrolytic manganese metal production, where selenium boosts yields, plus copper, lead, and steel alloys where it improves machinability. Agriculture and animal health account for another 20%, mostly as a fertilizer additive and livestock feed supplement. Glass manufacturing takes another 20%, using selenium to cancel out the greenish tint that iron impurities give ordinary container glass. Electronics and photovoltaics — including thin-film CIGS solar cells — make up 10%, and the remaining 10% splits between pigments, chemicals, and smaller uses like antidandruff shampoo and gun bluing.
That photovoltaic slice is small today but worth watching. Thin-film solar isn’t the dominant panel technology, but it’s one of the few selenium end uses that scales with a genuinely fast-growing market, unlike glass or metallurgy, which move with slower industrial cycles.
Why a Metal Nobody Thinks About Still Matters
Selenium isn’t just an industrial input. It’s a dietary essential — the human body needs it in trace amounts to build selenoproteins, a family of enzymes involved in antioxidant defense and thyroid hormone metabolism. Too little of it isn’t a theoretical problem. In China’s Keshan County, discovered in 1935 and the source of the disease’s name, chronically selenium-poor soil produced generations of a cardiomyopathy severe enough to cause heart failure in otherwise healthy people, and selenium supplementation programs in the affected regions cut its incidence sharply once the link was established.
That’s the strange duality of this metal: the same soil chemistry that makes selenium too scarce to mine directly is what makes it scarce enough in some diets to cause disease. It’s mined by accident, refined as a footnote to copper, and still essential enough that entire public health programs exist around getting enough of it.
The countries topping this list aren’t chasing selenium. They’re refining copper at scale, and selenium is what falls out the bottom. Understanding that is the difference between reading a ranked table and understanding why the table looks the way it does.