
Table of Contents
- What a Hurricane Actually Is
- How Hurricanes Form
- The Saffir-Simpson Scale, and What It Doesn’t Tell You
- Hurricane, Typhoon, or Cyclone?
- When Hurricane Season Actually Happens
- What Actually Kills People
- How Names Get Assigned
- Preparedness That Isn’t a Government Checklist
A hurricane doesn’t announce itself as dangerous the way you’d expect. The wind gets the headlines and the category number, but most of the people who die in these storms never feel hurricane-force wind at all. They drown, in their cars or their living rooms, sometimes hundreds of miles from where the storm made landfall. Understanding what a hurricane actually is — not the cable-news version, the mechanical version — changes what you pay attention to when one’s coming.
What a Hurricane Actually Is
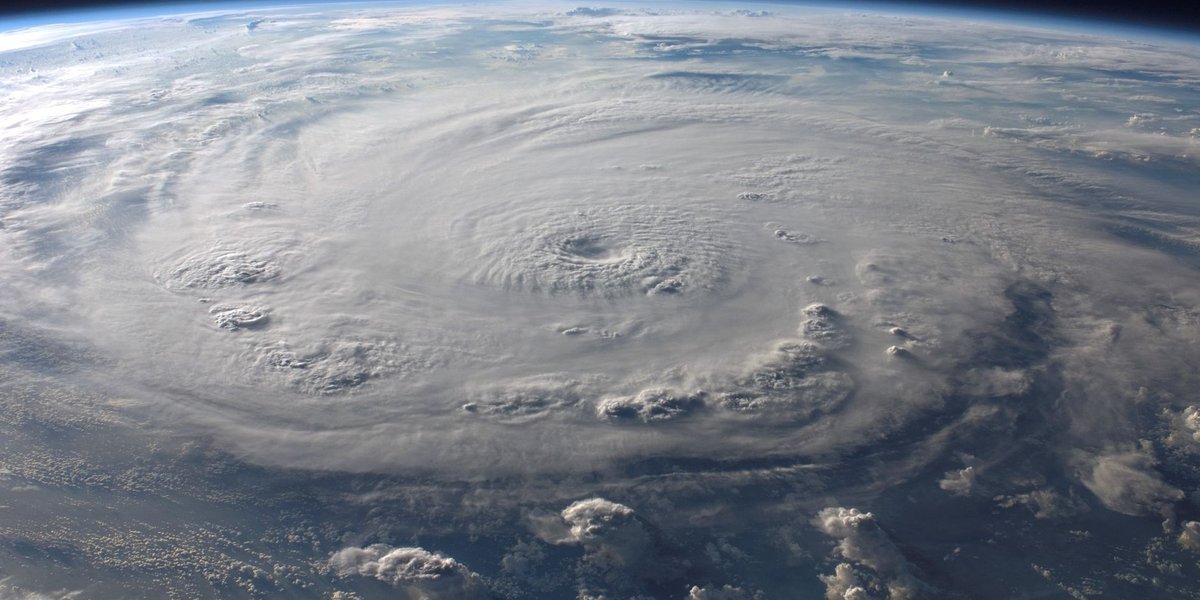
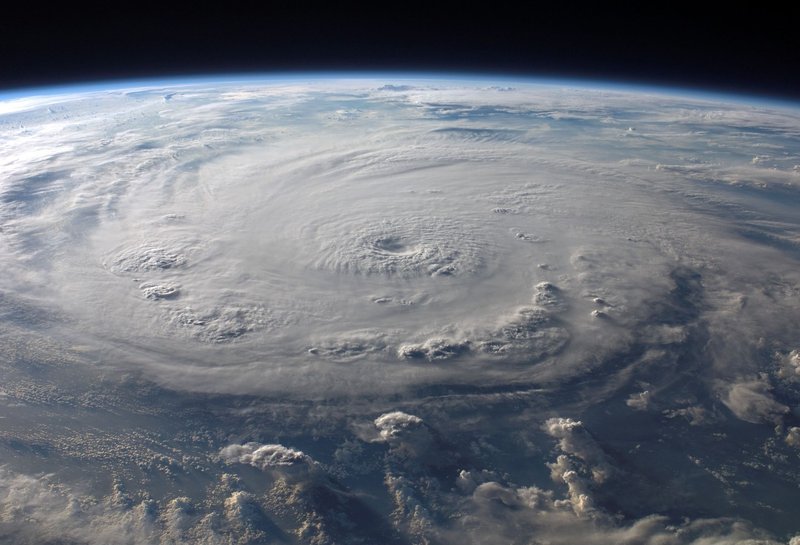
A hurricane is a tropical cyclone: a rotating, organized system of thunderstorms that forms over warm ocean water and sustains itself by pulling heat and moisture up from the sea surface. Once its sustained winds hit 74 mph, meteorologists in the Atlantic and Northeast Pacific basins start calling it a hurricane instead of a tropical storm. Below that threshold, it’s a tropical storm (39–73 mph) or a tropical depression (under 39 mph) — same basic machine, just not spun up yet.
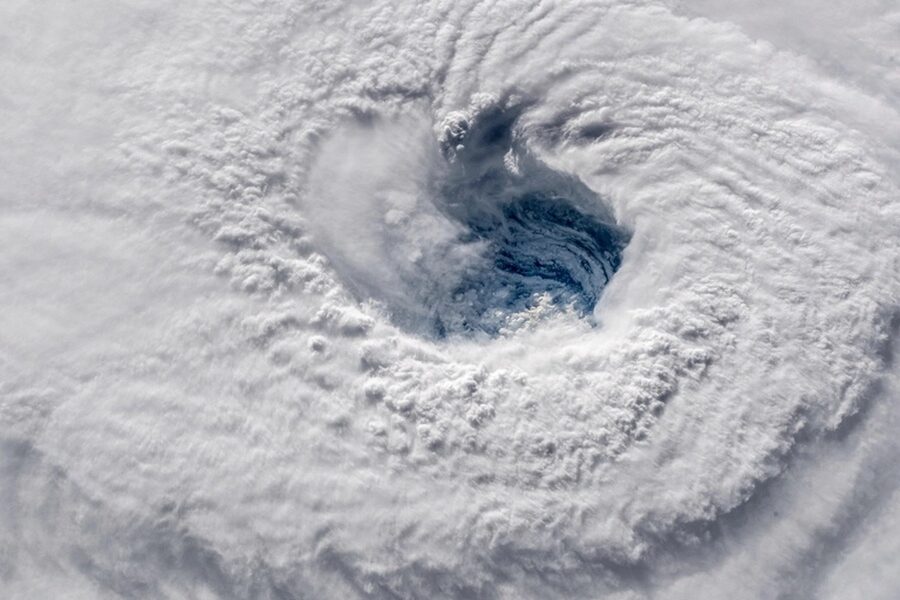
The defining feature isn’t the wind. It’s the structure: a low-pressure center (the eye), a ring of the most violent thunderstorms wrapped tightly around it (the eyewall), and spiral rainbands extending outward that can stretch a storm’s total footprint past 300 miles across. The eye itself is often eerily calm — clear skies, light wind — which is exactly why so many storm deaths in the pre-radar era came from people stepping outside during the lull, not realizing the second half of the eyewall was still coming.
How Hurricanes Form
Hurricanes need three ingredients, and losing any one of them kills the storm.
Warm water. Ocean surface temperatures need to be at least 80°F (26.5°C), and that warmth needs to extend down at least 150 feet or so. This is why hurricane season tracks the calendar — it takes months of summer sun to heat the upper ocean enough, which is also why storms tend to intensify most over the deep warm pool of the Gulf of Mexico and the Caribbean rather than the cooler open Atlantic.
Spin. The Coriolis effect — the deflection caused by Earth’s rotation — gives storms their counterclockwise spin (in the Northern Hemisphere) and is strong enough to organize a storm only more than about 300 miles from the equator. That’s the real reason true hurricanes essentially never form directly on the equator: there’s rotational force there to get them turning.
No wind shear. If winds at different altitudes are blowing at sharply different speeds or directions, they tear a developing storm apart before it can organize — literally decapitating the thunderstorm tops from the low-pressure center below. Calm, uniform winds through the atmosphere let a storm stack vertically and tighten instead.
When all three line up, warm, moist air rises off the ocean surface, creating an area of lower pressure below it. Air rushes in to fill that gap, picks up its own heat and moisture, and rises too. As the rising air cools, its water vapor condenses into thunderstorm clouds, releasing heat that powers even more rising air — a self-reinforcing feedback loop meteorologists call a heat engine. Add the Coriolis-driven spin, and a disorganized cluster of thunderstorms becomes a tropical depression, then a named tropical storm, then, if conditions keep cooperating, a hurricane.
The Saffir-Simpson Scale, and What It Doesn’t Tell You
The category number you hear on the news comes from the Saffir-Simpson Hurricane Wind Scale, and it measures exactly one thing: maximum sustained wind speed.
| Category | Sustained Winds | Expected Damage |
|---|---|---|
| 1 | 74–95 mph | Some damage to roofing, siding, and trees; power outages common |
| 2 | 96–110 mph | Major roof and siding damage; near-total power loss for days to weeks |
| 3 | 111–129 mph | Structural damage to homes; major hurricane threshold |
| 4 | 130–156 mph | Loss of roof structure and/or walls; area uninhabitable for weeks to months |
| 5 | 157+ mph | Total roof failure and wall collapse; long-term isolation likely |
Category 3 and above are classified as “major hurricanes,” and they account for a disproportionate share of the damage — roughly 85% of all hurricane-related destruction historically comes from major storms, despite being a minority of named storms in any given season.
Here’s the catch: the scale says nothing about size, forward speed, or water. Hurricane Harvey (2017) was “only” a Category 4 at landfall, but it stalled over Houston for days and dropped over 60 inches of rain in places — the wind category told you almost nothing about the flood disaster that followed. A slow-moving Category 1 sitting over your town can do more damage than a fast-moving Category 3 that blows through in six hours. Wind speed makes for a clean headline number. It’s a bad proxy for how bad your specific experience of the storm will be.
Hurricane, Typhoon, or Cyclone?
Same storm, different name, purely a matter of geography. A tropical cyclone with sustained winds over 74 mph is called:
- A hurricane in the Atlantic and Northeast/Central Pacific (basically anywhere that affects the Americas)
- A typhoon in the Northwest Pacific (the basin that hits the Philippines, Japan, China, and Southeast Asia)
- A cyclone in the South Pacific and Indian Ocean (Australia, India, Mozambique, Madagascar)
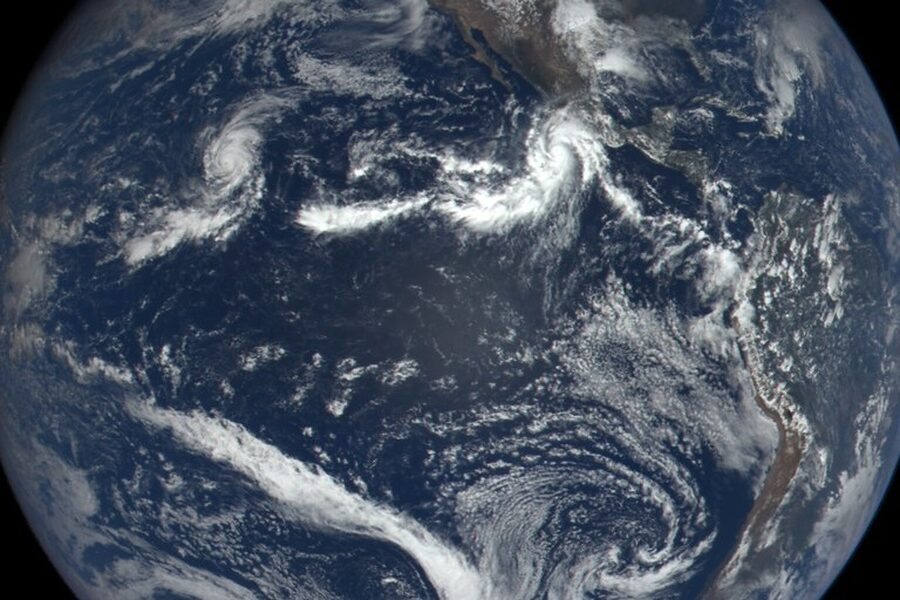
The Northwest Pacific basin, where typhoons form, is the most active on Earth and produces the strongest storms on record by sustained wind speed, in part because it has the largest expanse of warm open water for a storm to feed on without hitting land. There’s no meaningful structural difference between a Category 5 hurricane and a “super typhoon” — it’s the same physics wearing a regional label. Notable examples of cyclones from across the globe demonstrate this.
When Hurricane Season Actually Happens
The Atlantic hurricane season runs officially from June 1 to November 30, with activity peaking around September 10 — the point where ocean heat content, low wind shear, and minimal Saharan dust interference all line up at once. August through October produces the large majority of major hurricanes; storms that form in June or November tend to be weaker and more disorganized because the ocean hasn’t fully heated up yet, or has already started cooling.
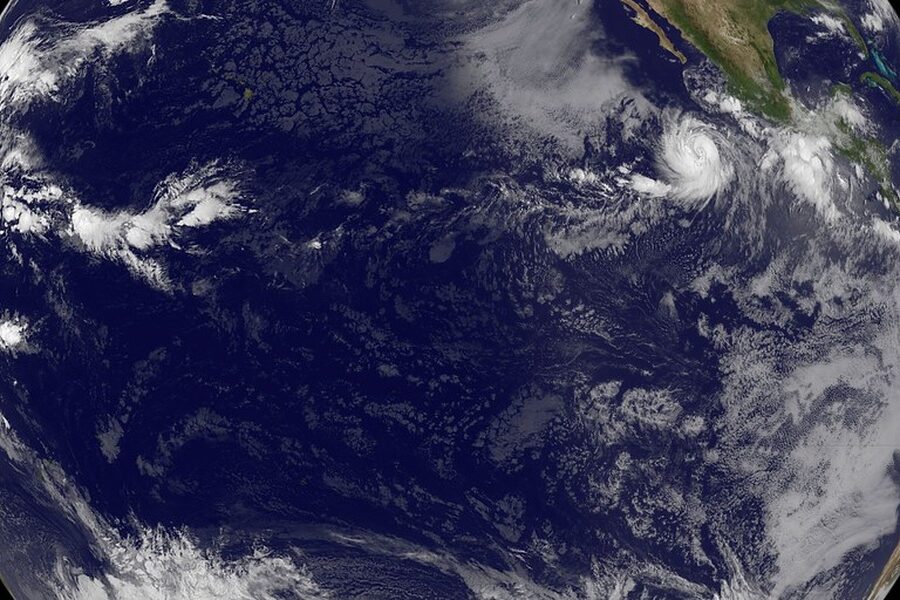
The Eastern Pacific season runs slightly earlier, from May 15 to November 30, since that ocean warms up sooner. NOAA issues a seasonal outlook every May, forecasting how many named storms, hurricanes, and major hurricanes to expect based on factors like El Niño/La Niña status and Atlantic sea-surface temperatures — El Niño years tend to suppress Atlantic activity by increasing wind shear, while La Niña years tend to favor it.
What Actually Kills People
This is the part the classroom explainers skip, and it’s the most important number in this whole article: according to NHC research, 86% of direct hurricane and tropical storm deaths in the U.S. since 2013 have come from water, not wind. Freshwater flooding from rainfall now accounts for about 57% of those deaths, storm surge and rip currents make up most of the rest, and wind — the thing the category number measures — causes only around 12%.
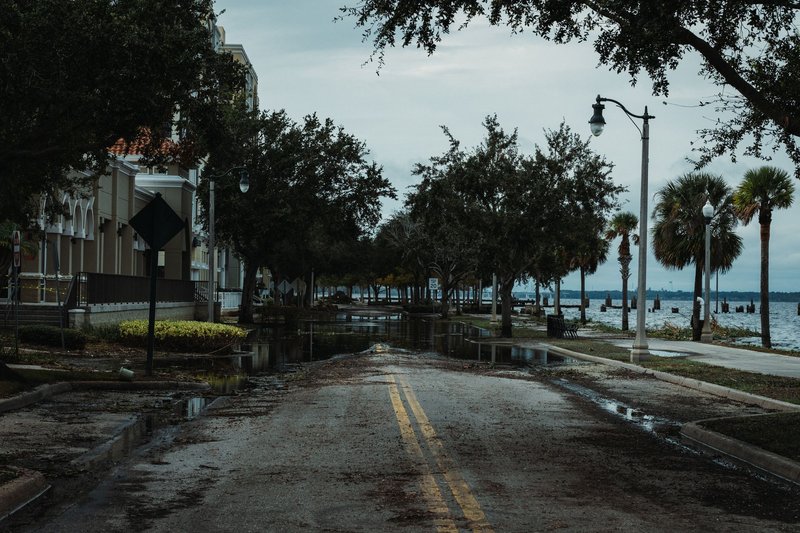
Storm surge is the abnormal rise of ocean water pushed ashore by the storm’s winds, and it’s often the deadliest single element of a landfalling hurricane. It’s not a wave — it’s the entire sea level rising, sometimes 15–20 feet above normal in the worst cases, flooding areas that never see ocean water in calm weather. Historical examples of hurricanes show the devastation: Hurricane Katrina’s surge in 2005 reached nearly 28 feet in parts of Mississippi.
Inland flooding from rainfall is the newer, growing threat, and it doesn’t care about your distance from the coast. A weakening storm can dump a foot or more of rain over interior states days after landfall, well after the wind warnings have expired and people have stopped paying attention.
The takeaway: the category number tells you about wind. It tells you almost nothing about your actual risk if that risk is water.
How Names Get Assigned
The World Meteorological Organization maintains rotating six-year lists of alternating male and female names for each basin, reused every six years unless a storm is “retired” for being especially deadly or costly — Katrina, Harvey, Ian, and Helene are all retired names, replaced permanently on future lists. If a season produces more storms than the 21-name list can cover (letters Q, U, X, Y, and Z are skipped), forecasters move to a supplemental list rather than the Greek alphabet, which the WMO discontinued after the record-shattering 2020 season caused confusion.
Preparedness That Isn’t a Government Checklist
Most preparedness pages are written for an abstract household that doesn’t exist. Here’s what actually matters, in order of how often it gets skipped.
Know your flood zone, not just your evacuation zone. Coastal evacuation zones address storm surge. They say nothing about whether your street floods from three days of heavy rain. Check your county’s flood zone map separately — plenty of homes ten miles inland have flooded from rainfall while technically sitting outside any surge evacuation area.
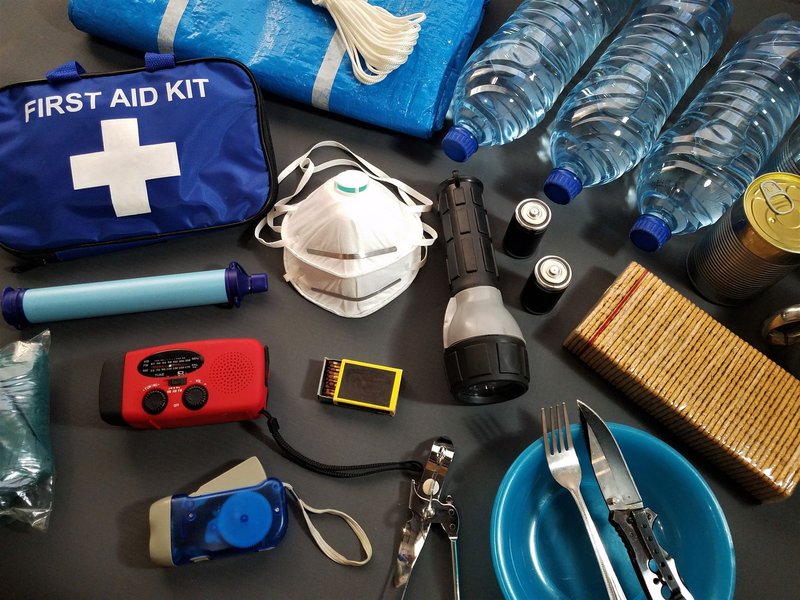
Fill the bathtub and every spare container before landfall, not after. Water systems lose pressure or get contaminated when treatment plants lose power or flood. This is a five-minute task people remember at 11pm the night before, if at all.
Photograph your property before the storm, not after. Insurance disputes over what damage existed before versus after a hurricane are common and slow. Timestamped photos of your roof, fence, and belongings settle arguments that would otherwise drag on for months.
Don’t trust the eye. If you’re in the storm’s path and the wind suddenly stops and the sky clears, you’re in the eye — not the clear. The second eyewall is coming from the opposite direction, often within 20–40 minutes depending on the storm’s forward speed and size.
Full tank, half-charged everything else. Fill your car’s gas tank when the storm enters the five-day forecast cone, not the day before — lines get long and stations run dry fast. Charge phones, power banks, and any battery equipment to full; outages after a major hurricane can run one to three weeks in hard-hit areas, not days.
None of this replaces your local emergency management office’s evacuation orders — follow those without exception. But the checklist above is the layer between “technically prepared” and actually not losing days of your life to a storm you saw coming for a week.