
TLDR
Air pollution isn’t one thing — it’s a grid. Cross the pollutant (particulate matter, gases like CO and NO2, VOCs, biological particles) with the source (cars and trucks, factories, farms, wildfires, your own kitchen) and you get almost every real-world example. Outdoor smog from tailpipes and power plants gets the headlines, but indoor air — cooking fumes, mold, cleaning sprays — is often the more concentrated exposure, since you’re breathing it in a closed room for hours. Below: a full breakdown by type, by source, and a set of specific, dated events (2025–2026 wildfire smoke, LA’s historical smog) that show what these categories look like when they actually happen.
Table of Contents
- The Two Axes That Explain Almost Every Example
- Pollutant Types, With Real Examples
- Examples by Source: Mobile
- Examples by Source: Stationary
- Examples by Source: Area Sources
- Examples by Source: Natural
- Indoor Air Pollution Examples
- Real Events: What These Categories Look Like in Practice
- What Each Pollutant Actually Does to You
The Two Axes That Explain Almost Every Example
Most lists of air pollution examples just enumerate — smoke, exhaust, mold, pesticides — without a system. That’s why they’re hard to remember. There’s a cleaner way to think about it: every example is a combination of what the pollutant is and where it comes from.
The “what” is the pollutant category: particulate matter, gases, volatile organic compounds (VOCs), or biological pollutants. The “where” is the source category: mobile (things that move, like vehicles), stationary (fixed points, like a power plant smokestack), area sources (diffuse and small-scale, like dry cleaners or agricultural fields), natural events (wildfires, volcanoes, dust storms), and indoor sources (your house, specifically). Once you have both axes, “examples of air pollution” stops being a random list and becomes a lookup table.
Pollutant Types, With Real Examples
| Pollutant Type | What It Is | Real-World Examples |
|---|---|---|
| Particulate matter (PM2.5, PM10) | Solid or liquid droplets suspended in air, small enough to lodge in lungs | Wildfire smoke, diesel exhaust soot, construction dust, cigarette smoke |
| Carbon monoxide (CO) | Colorless, odorless gas from incomplete combustion | Car exhaust in idling traffic, gas furnaces, charcoal grills used indoors |
| Nitrogen oxides (NOx, including NO2) | Gases from high-temperature burning | Vehicle exhaust, gas stoves, power plant emissions |
| Sulfur dioxide (SO2) | Gas released when sulfur-containing fuel burns | Coal-fired power plants, oil refineries, ship engines burning bunker fuel |
| Ground-level ozone (O3) | Secondary pollutant formed when NOx and VOCs react in sunlight | Summer smog over urban areas, especially during heat waves |
| Volatile organic compounds (VOCs) | Carbon-based chemicals that evaporate easily at room temperature | Paint fumes, gasoline vapor, aerosol sprays, new furniture off-gassing |
| Lead (Pb) | Heavy metal particulate | Older leaded-gasoline residue in soil/dust, some industrial smelting, lead paint dust |
| Biological pollutants | Airborne organic material | Mold spores, pollen, dust mite waste, pet dander, bacteria from HVAC systems |
That table alone covers the bulk of what shows up when people search “examples of air pollution.” The rest of this piece breaks it out by where each one actually comes from — because a source lens changes what you can do about it.
Examples by Source: Mobile
Mobile sources are anything that moves and burns fuel. This is the category most people picture first, and for good reason — EPA data consistently ranks on-road vehicles among the largest contributors to urban nitrogen oxides and CO.
- Car and truck exhaust — NOx, CO, and PM2.5, worse in stop-and-go traffic than at highway speed
- Diesel trucks and buses — disproportionately high PM output per mile compared to gasoline engines
- Airplanes — NOx and particulate emissions concentrated near airports during takeoff and landing
- Cargo ships and ferries — SO2 from bunker fuel, a major contributor in port cities
- Off-road equipment — construction machinery, lawn mowers, and generators, often with weaker emissions controls than road vehicles
Examples by Source: Stationary
Stationary sources sit in one place and typically emit at a larger, more continuous scale.
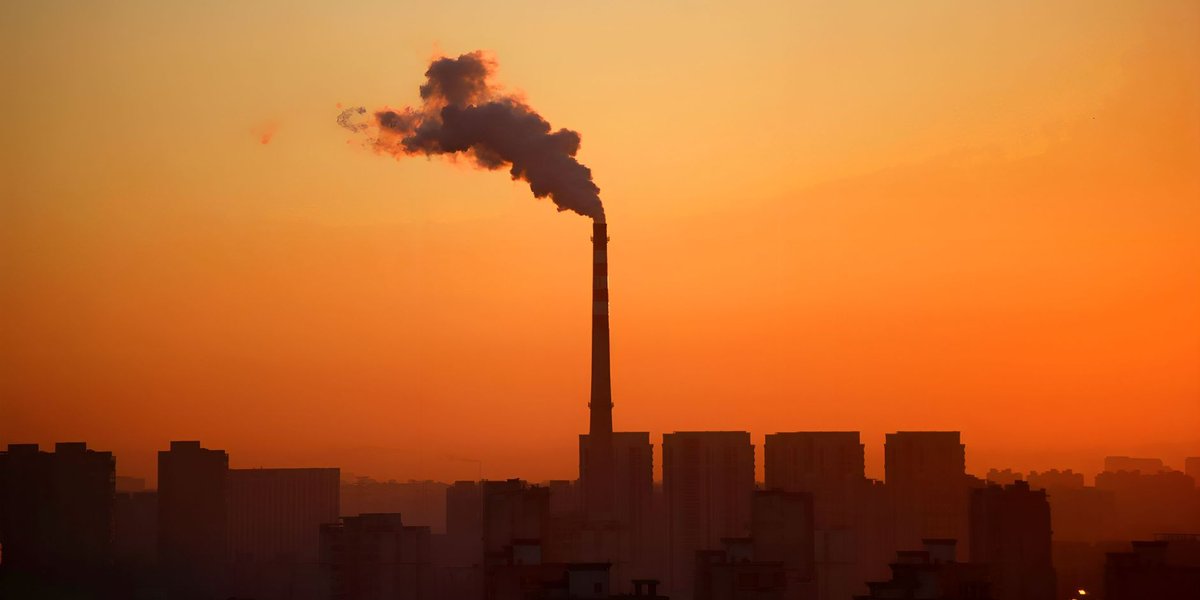
- Coal and natural gas power plants — SO2, NOx, mercury, and CO2
- Oil refineries — VOCs, SO2, and benzene near processing units
- Steel mills and smelters — particulate matter and heavy metals, including lead
- Cement and concrete plants — dust-heavy particulate emissions
- Chemical manufacturing plants — a mix of VOCs and hazardous air pollutants specific to the process
Examples by Source: Area Sources
Area sources are small individually but add up regionally because there are so many of them.
- Dry cleaners — VOC emissions from solvents like perchloroethylene
- Auto body shops — paint and solvent VOCs
- Agricultural operations — ammonia, dust from tilling, and pesticide drift
- Residential wood stoves and fireplaces — PM2.5, especially in winter inversion conditions
- Gas stations — VOC vapor released during refueling
Examples by Source: Natural
Not all pollution is human-made, though human activity increasingly amplifies these events.
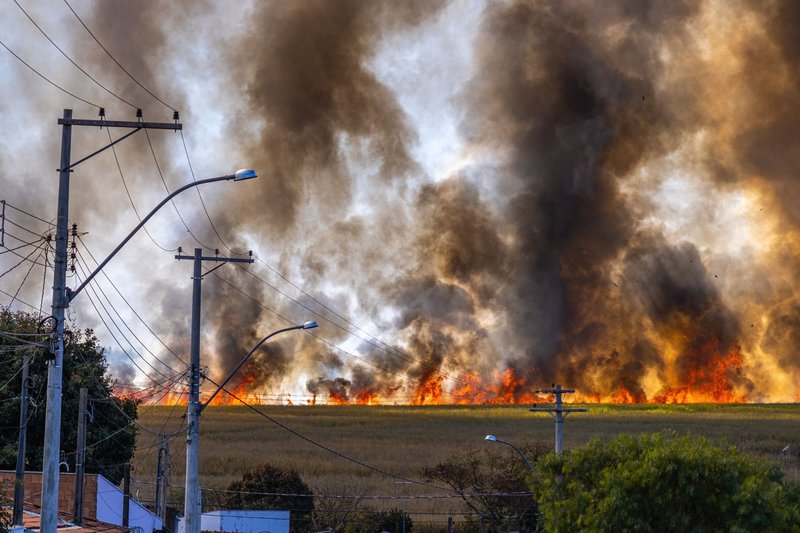
- Wildfires — massive PM2.5 output that can travel thousands of miles from the burn site
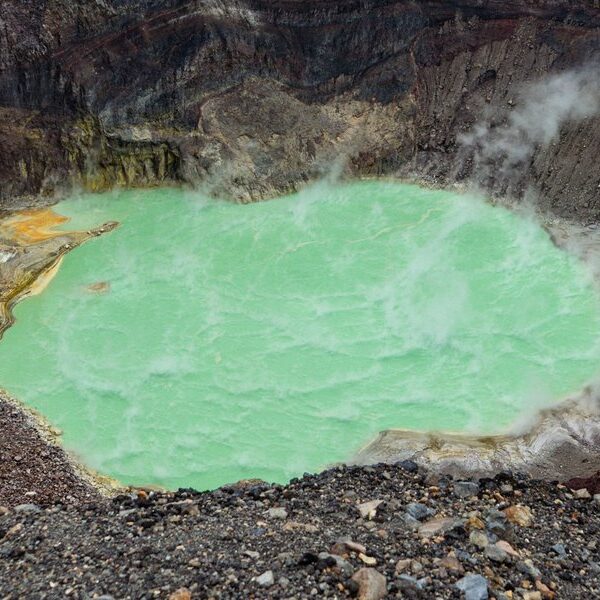
- Volcanic eruptions — SO2 and ash particulate, sometimes measurable continents away
- Dust storms — coarse particulate matter (PM10) from dry, exposed soil
- Pollen release — seasonal biological pollutant spikes, worse with longer growing seasons
Indoor Air Pollution Examples
Indoor air pollution rarely makes the same headlines as smog, but it’s often the pollution you’re exposed to longest, in the least ventilated space you occupy. The National Park Service and EPA both flag indoor sources as a meaningfully underrated exposure category.

- Gas stoves — NO2 concentrations in an unventilated kitchen can spike well above outdoor limits during cooking
- Mold and mildew — biological pollutant, common in bathrooms and basements with poor humidity control
- Cleaning products and aerosols — VOCs, especially from scented sprays and bleach-based products
- Tobacco smoke — a mix of PM2.5, CO, and dozens of VOCs
- New furniture and carpet off-gassing — formaldehyde and other VOCs, highest in the first weeks after installation
- Radon — a naturally occurring radioactive gas that seeps in from soil and rock beneath a building
- Candles and incense — PM2.5 and VOC output that scales with how often they’re burned in an enclosed room
Real Events: What These Categories Look Like in Practice
Abstract categories get more useful once you attach them to something that actually happened.
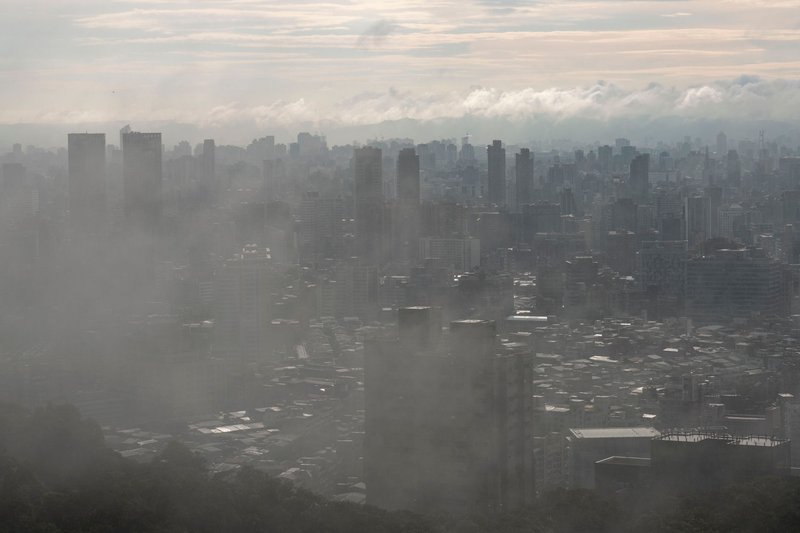
Los Angeles smog, mid-20th century. LA’s basin geography traps vehicle and industrial emissions against the surrounding mountains, producing the photochemical smog — ground-level ozone formed from NOx and VOCs reacting in sunlight — that made the city a textbook case for air quality regulation.
Canadian wildfire smoke over the US, 2025–2026. In August 2025, smoke from Canadian wildfires blanketed Minnesota, Wisconsin, Michigan, Iowa, and Illinois simultaneously, pushing Chicago’s air quality to the worst of any major city in the world for a stretch that August. The pattern repeated and intensified in July 2026, when air quality alerts covered more than 100 million people across 18 states and Washington, D.C., with Detroit, Chicago, and New York ranking among the most polluted cities on the planet for several days running.
Winter inversions in mountain valleys. Cities like Salt Lake City and parts of the Po Valley in Italy trap cold, pollutant-laden air under a warmer layer during winter, concentrating PM2.5 from vehicles and wood stoves close to ground level for days at a time.
Indoor cooking exposure. A gas stove running during a stir-fry, in a kitchen without a working range hood, can push indoor NO2 above levels the WHO associates with respiratory irritation — for the length of the meal, in a room with a door closed.
What Each Pollutant Actually Does to You
| Pollutant | Primary Health Effect |
|---|---|
| PM2.5 | Penetrates deep into lungs and bloodstream; linked to asthma, cardiovascular disease |
| Carbon monoxide | Blocks oxygen transport in blood; headaches, dizziness, and at high levels, death |
| Nitrogen dioxide | Airway inflammation, worsens asthma, especially in children |
| Sulfur dioxide | Airway constriction, particularly for people with asthma |
| Ground-level ozone | Chest pain, coughing, reduced lung function during exertion |
| VOCs | Range from eye/throat irritation to, for some compounds, long-term organ or cancer risk |
| Radon | Leading cause of lung cancer among non-smokers |
None of these examples exist in isolation. A single smoggy afternoon in a city under a wildfire smoke advisory is stacking PM2.5 from the fire on top of NOx from rush-hour traffic on top of whatever’s drifting out of the nearest refinery. The categories are useful for identifying sources — but the exposure itself doesn’t sort itself into tidy boxes, which is exactly why air quality indexes track combined readings rather than single pollutants.