
TLDR
Ontario runs on five resource bases: boreal forest, hardrock minerals, Great Lakes freshwater, farmland, and a nuclear-and-hydro power grid. Mining contributed roughly $7.9 billion to provincial GDP in 2024 and supports about 150,000 jobs when you count processing and supply chains. Forestry adds another $5.2 billion and 154,500 jobs. Agriculture and food together account for close to 900,000 jobs — 14% of everyone working in the province. About 87% of Ontario’s land mass is Crown land, and 90% of its forests sit on that Crown land, which means the province, not private owners, makes most of the calls on how these resources get used.
The short version, then the long one
Most pages on this topic are either a government inventory list or a promotional pitch deck. This one’s neither. Ontario’s resource base breaks into five categories that actually interact with each other — cut too much forest and you change the watershed; mine in the wrong spot and you’re negotiating with a First Nation that’s had unresolved treaty rights there since the 1900s. Here’s what’s actually in the ground, the water, and the trees, with numbers current as of 2025.
Forests: still the backbone of the north
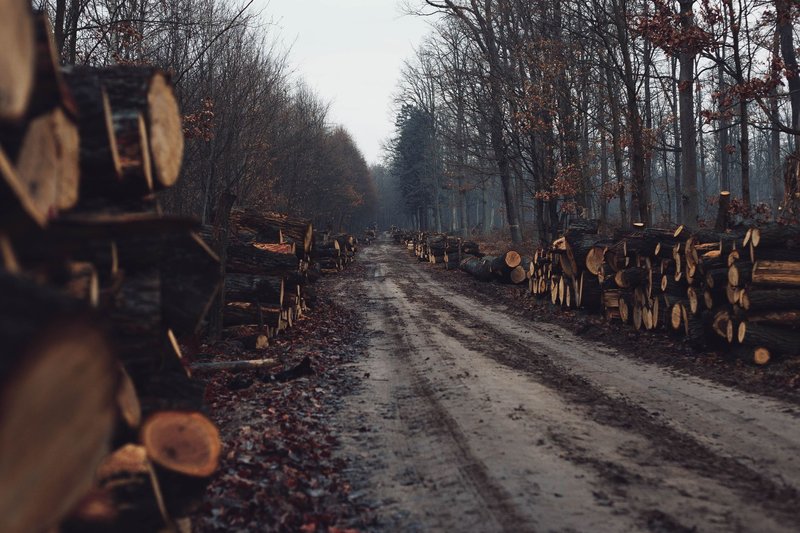
Ontario has about 71 million hectares of forest, most of it boreal, stretching from the Great Lakes–St. Lawrence mixed forest in the south up through black spruce country near Hudson Bay. Roughly 90% of that forested land is Crown land, which means the province leases cutting rights to companies rather than selling the land outright — a distinction that matters when you’re trying to figure out who’s accountable when a cutblock goes sideways.
The sector directly employed 51,500 people in 2025, and once you count everyone downstream — sawmills, pulp and paper, trucking — total employment tied to the forest sector tops 154,500 jobs. One in four communities in Northern Ontario depends significantly on this income. The industry generated $20.8 billion in revenue in 2024 and contributed $5.2 billion to GDP the same year, with $8.3 billion in exports in 2025. Wood product manufacturing is the largest single employer within the sector at 45% of forestry-related jobs, ahead of paper manufacturing at 43%.
The catch: over 80% of the direct jobs sit in Southern Ontario, where the mills and secondary manufacturing are, even though the actual trees come from the north. That’s the same geographic split you see across most of Ontario’s resource economy — extraction up north, processing and payroll down south. Job Bank’s own outlook projects a moderate decline in forestry and forest products employment between 2025 and 2027, driven mostly by softening demand for lumber and paper.
Minerals and mining: gold, nickel, and a road that isn’t finished yet
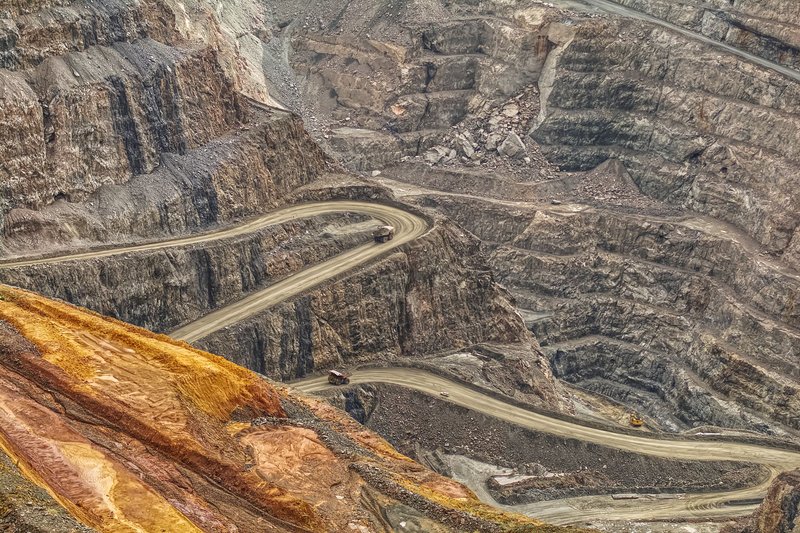
Ontario is Canada’s top gold producer. Eighteen active gold mines generated $6.5 billion in value in 2023, out of 36 active mining operations province-wide pulling in $15.7 billion total that year across gold, base metals, iron, platinum group metals, and industrial minerals. The sector’s GDP contribution has been reported anywhere from $7.9 billion (2024, direct) to $23.8 billion (2023, including downstream processing), depending on how wide you draw the boundary — which is exactly the kind of inconsistency that makes government pages hard to use for a quick answer.
Direct mining jobs run around 31,000, with another 47,000 in mineral processing and supply services — call it close to 150,000 once you include the full supply chain. Compensation is the standout number here: average pay in mineral extraction sits near $149,661 a year, almost double the all-industry average.
The name everyone’s watching is the Ring of Fire, a nickel, copper, and chromite deposit in the James Bay lowlands that’s been “about to happen” for over a decade. That’s changing, slowly. Ontario’s “One Project, One Process” approval model is meant to cut provincial review times in half, and construction on the Webequie Supply Road is scheduled to start in June 2026 — five years ahead of the original timeline, if it holds. A co-led regional assessment with 15 First Nations is running in parallel, because the region sits on land where consultation isn’t optional, it’s the process. Federal money is stacking up behind it too: a $2 billion Critical Minerals Sovereign Fund from the 2025 federal budget, plus a $500 million provincial Critical Minerals Processing Fund aimed at building refining capacity in-province instead of shipping ore out raw.
Worth flagging: Canada’s EV sales fell more than 35% in mid-2025 after government incentive programs got cancelled, which has cooled some of the battery-metals demand that was supposed to justify Ring of Fire’s build-out costs. The minerals are confirmed. The market for them is not guaranteed.
Water: one-fifth of the world’s fresh surface supply, sitting on your doorstep
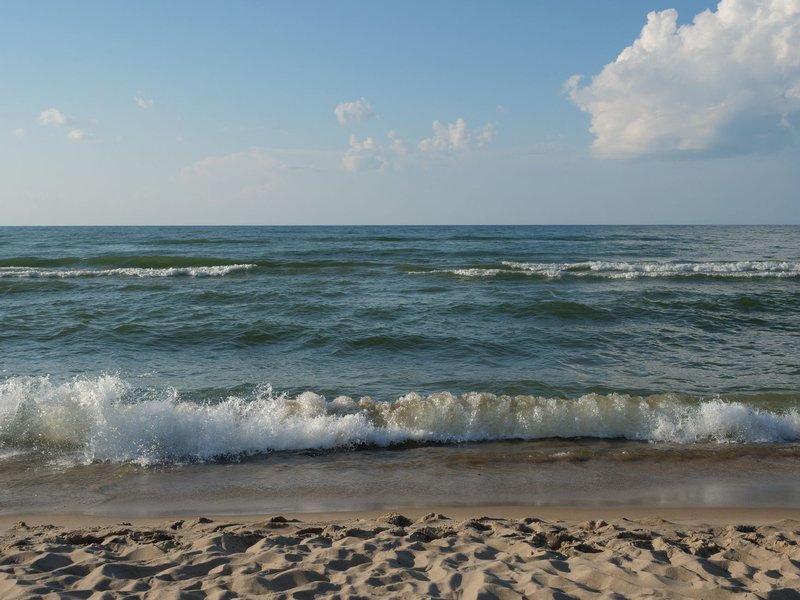
The Great Lakes hold about 6 quadrillion gallons of water — roughly 20% of the world’s surface freshwater — and Ontario borders four of the five: Superior, Huron, Erie, and Ontario. Lake Ontario is the only one of the five that sits entirely within the Ontario–New York corridor. Combined, the Great Lakes basin supplies drinking water to more than 40 million people across two countries, eight U.S. states—including New York, which shares Ontario’s dependence on these freshwater resources—and this one province.
That scale creates a governance problem most resource pages skip past: no single government controls the basin. Water levels, invasive species like sea lampreys and zebra mussels, and industrial discharge all cross jurisdictions, which is why the Great Lakes–St. Lawrence River Basin agreement exists — a patchwork of state, provincial, and federal commitments rather than one clean law. Beyond the lakes, Ontario’s rivers feed most of its hydroelectric generation, which brings us to energy.
Energy: nuclear does the heavy lifting, not hydro
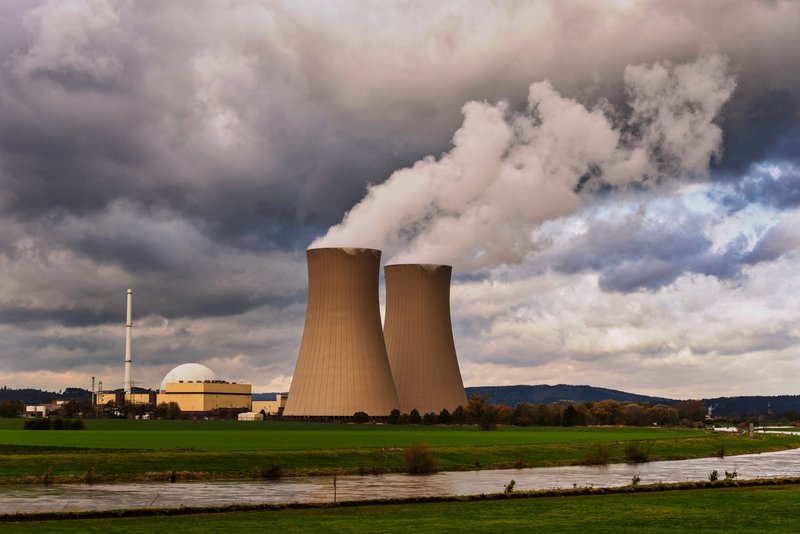
The popular image of Ontario’s grid is hydro dams humming away on northern rivers. The real number: nuclear supplies 46.2% of Ontario’s electricity, more than double what hydro provides at 22.5%. Natural gas and other thermal sources cover 19.4%, wind sits at 9.3%, solar at 2.1%, and bioenergy and storage fill in the rest at under 1% combined. Nuclear and hydro together still cover close to three-quarters of the province’s power, which is why Ontario’s grid ranks among the cleanest in North America on a per-kilowatt-hour basis — despite the popular narrative crediting wind and solar for that.
This matters for the resource conversation because uranium refining and nuclear infrastructure are themselves resource-dependent industries, and Ontario’s newer small modular reactor projects at Darlington are betting the province’s next decade of power growth on more nuclear, not more hydro. There isn’t much room to build new dams anyway — most of the good river sites were developed a century ago.
Farmland: smaller than the prairies, more valuable than the map suggests
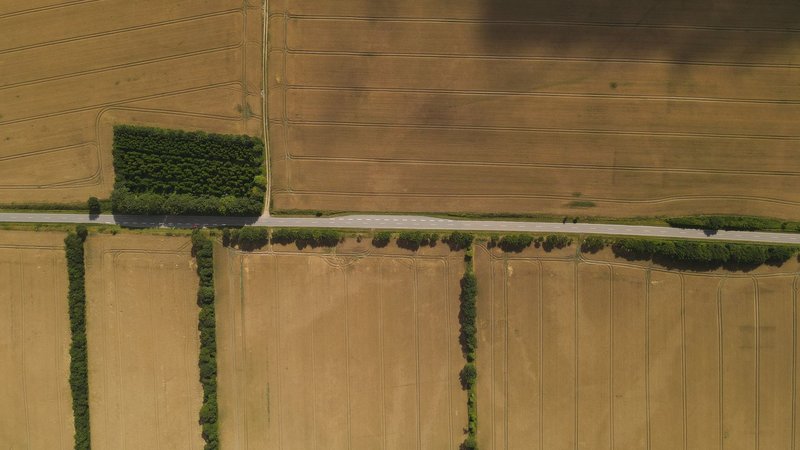
Ontario has about 5 million hectares of farmland, which puts it fourth among the provinces behind Saskatchewan, Alberta, and Manitoba — no contest on acreage. But farmland alone contributed $8.8 billion to provincial GDP in 2024, and once you add food manufacturing, the agri-food sector’s contribution jumps to nearly $51 billion. Direct farm employment was 71,700 people in 2024; combined farm-plus-food-manufacturing jobs run close to 900,000, or about 14% of every full-time job in the province.
The reason a smaller land base still produces an outsized economy is proximity: Ontario’s farmland sits closest to the province’s own population and to the U.S. Northeast, cutting transport costs that prairie grain operations don’t have to worry about as much on export volumes but do on perishables. Job Bank’s 2025–2027 outlook calls for flat employment growth, citing automation, trade uncertainty, and increasingly unpredictable growing seasons as the main drags.
Crown land and who actually decides
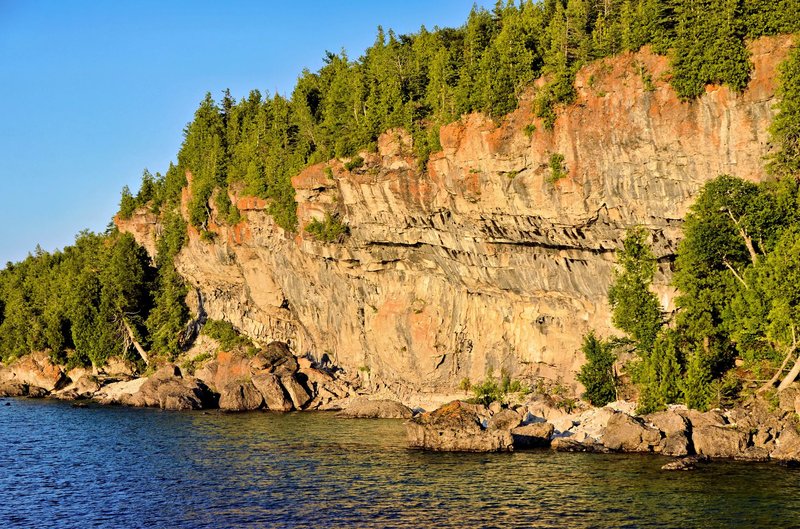
About 77% of Ontario is Crown land managed under the Public Lands Act, with another roughly 10% held as parks and conservation reserves — call it 87% Crown-controlled in total. The split isn’t even: more than 95% of Northern Ontario is Crown land, while Southern Ontario, settled and farmed for two centuries, has comparatively little.
The Ministry of Natural Resources administers this land along with the beds of most lakes and rivers, which is why forestry leases, mining claims, and aggregate permits all route through the same provincial ministry rather than through private landowners. It also means Indigenous land and resource-rights questions sit close to the surface of nearly every major resource decision in the north — the Ring of Fire’s regional assessment with 15 First Nations isn’t a side process, it’s a required one, because so much of the deposit sits on or near land where treaty and consultation obligations attach directly to Crown ownership.
What connects all five
Forestry, mining, water, energy, and farmland aren’t separate line items — they compete for the same rivers, the same labor pool in the north, and the same government approvals. A road built for the Ring of Fire opens up new forestry access too. A drought year that hurts farmland also drops hydro output. Ontario’s resource base is large enough to make headlines in isolation, but understanding it means seeing how tightly the pieces are wired together, not just how big each one is on its own.