
Table of Contents
- TLDR
- Natural vs. Synthetic: Why Geology Decides Who Wins
- The Countries That Actually Produce Soda Ash
- Production at a Glance
- What’s Pulling Demand Higher Right Now
- The Deposits Nobody’s Tapped Yet
TLDR
China produces more soda ash than any other country by a wide margin, almost entirely through synthetic manufacturing. The United States is a distant second but dominates natural production — the Green River Basin in Wyoming holds the largest trona deposit on Earth, and it’s cheap enough to export halfway around the world and still undercut synthetic plants closer to the buyer. Türkiye is the one to watch: its Ankara-basin trona operations have expanded aggressively and are positioning the country as a serious natural-soda-ash exporter within the decade. India, Russia, and Bulgaria round out the mid-tier synthetic producers, while Botswana and Kenya supply smaller, geologically-driven natural output that punches above its weight regionally.
Natural vs. Synthetic: Why Geology Decides Who Wins
Soda ash — sodium carbonate, Na₂CO₃ — gets made one of two ways, and which way a country uses comes down almost entirely to what’s sitting underground.
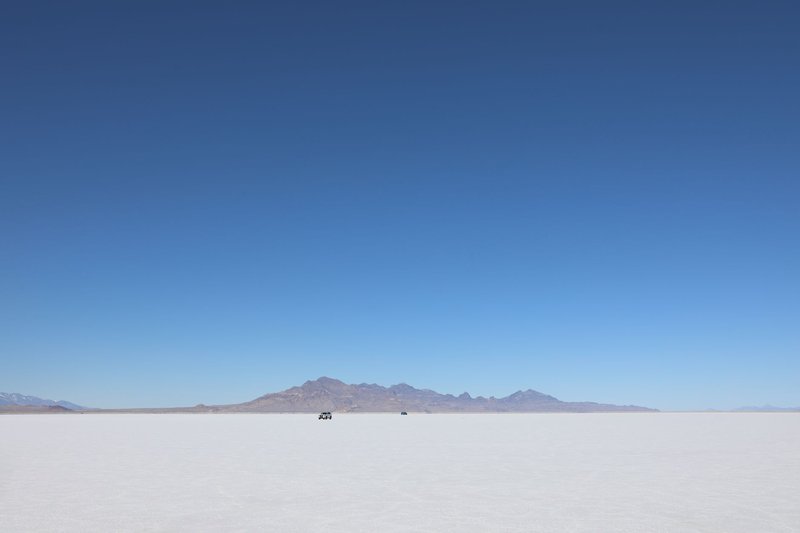
Natural production starts with trona ore or sodium-rich brine that’s already sodium carbonate in a near-usable form. Mine it, dissolve it, purify it, and you’ve skipped most of the manufacturing. This is the low-cost route, but only a handful of places on the planet have deposits worth mining at scale: the Green River Basin in Wyoming, the trona beds around Beypazarı and Kazan in Türkiye, the Makgadikgadi salt pans in Botswana, and a few East African rift lakes.
Synthetic production uses the Solvay process, developed in Belgium in the 1860s: limestone, salt brine, and ammonia react through a multi-step reaction to produce sodium carbonate from scratch. It works anywhere with access to limestone and salt, which is most of the world — that’s exactly why it became the default for countries without natural deposits. The tradeoff is cost. Solvay plants burn through energy and produce calcium chloride waste that has to go somewhere, and neither of those problems exists for a trona mine.
The practical result: natural producers export aggressively because their production cost is lower even after shipping, while synthetic producers mostly serve their own domestic industries and only export when regional demand or trade logistics make it worthwhile.
The Countries That Actually Produce Soda Ash
1. China — the volume leader
China produces roughly half of the world’s soda ash, most of it synthetic, feeding a domestic glass and detergent manufacturing base larger than any other country’s. Historically that meant near-total reliance on Solvay and the related Hou process (a Chinese-developed variant that recovers ammonium chloride as a byproduct instead of calcium chloride waste). That’s shifting: natural trona-like deposits discovered in Inner Mongolia’s Alashan region, particularly around Chahannor and Tianjiao, have brought lower-cost natural output online over the past several years, and new capacity there keeps getting added. China is still the country to watch for oversupply risk — when Chinese producers run at full capacity, it moves global pricing.
2. United States — the natural-production giant
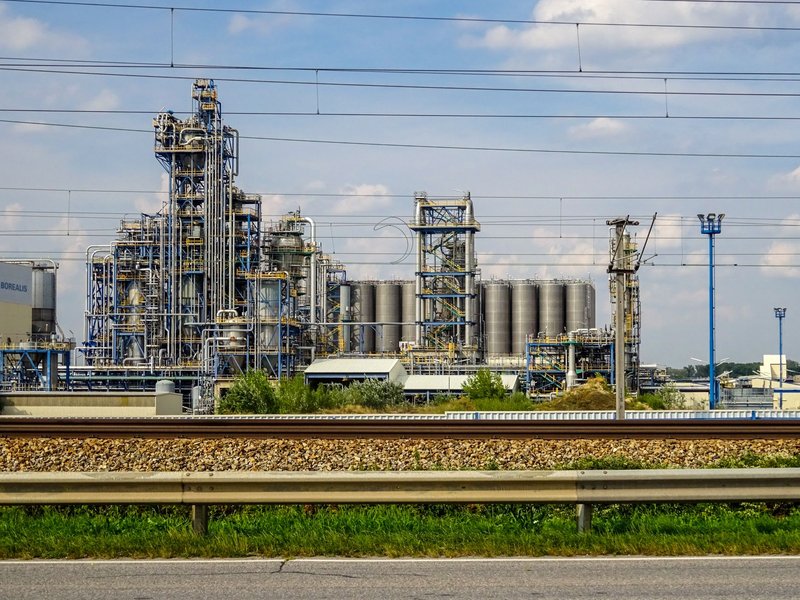
Every ounce of commercial soda ash the US produces is natural, mined from the Green River Basin near Green River, Wyoming — the largest known trona deposit in the world, discovered in the 1930s during oil exploration. Producers there, including Tata Chemicals, Genesis Alkali, and Sisecam Wyoming (which absorbed Ciner’s US operations), pull ore from underground mines and solution-mine operations that have been running for decades without meaningfully denting the reserve. Roughly half of US output ships overseas, with Asia — particularly China and Southeast Asia — as the largest buyer. That export dependency is also the country’s biggest vulnerability: American soda ash competes directly with Chinese domestic production in the same Asian glass markets it sells into, so freight rates and Chinese capacity swings hit US producers’ margins directly.
3. Türkiye — the fastest-growing natural producer
Türkiye’s trona basin northwest of Ankara has gone from a regional curiosity to a genuine global competitor in under two decades. Eti Soda and Kazan Soda Elektrik — both under the Ciner Group / WE Soda umbrella — have expanded capacity aggressively, and the country has stated ambitions to become one of the world’s leading soda ash exporters on the strength of natural production costs that rival Wyoming’s. Unlike the US, Türkiye sits close to European and Middle Eastern glass and detergent markets, giving it a shipping advantage the American Gulf Coast route doesn’t have. Watch this one — capacity additions here are reshaping trade flows faster than almost anywhere else in the industry.
4. India — synthetic-first, with a natural wrinkle
India’s soda ash industry is majority synthetic, anchored by Tata Chemicals’ Mithapur complex in Gujarat and GHCL’s Sutrapada plant, both drawing on brine resources near the Rann of Kutch salt flats — technically a hybrid that leans more synthetic than pure natural extraction. Domestic demand from India’s growing flat-glass and detergent sectors absorbs most of what gets produced, and capacity additions here track India’s broader industrial growth rather than export ambition.
5. Russia — the largest producer nobody talks about
Bashkir Soda Company, based in Sterlitamak, runs one of the largest single synthetic soda ash operations in the world and has historically supplied not just Russia but much of Central Asia and parts of Eastern Europe. Sanctions and shifting trade routes since 2022 have complicated its export logistics, but domestic Russian glass and chemical demand keeps the plant running at scale regardless of what happens on the export side.
6. Bulgaria — Europe’s synthetic export hub
Solvay’s Devnya plant near the Black Sea is the largest synthetic soda ash facility in Europe, and Bulgaria’s own domestic demand is far too small to absorb what it makes. That imbalance turns Bulgaria into one of Europe’s main soda ash exporters, shipping to glass and detergent manufacturers across the continent and beyond.
7. Botswana — small volume, high leverage
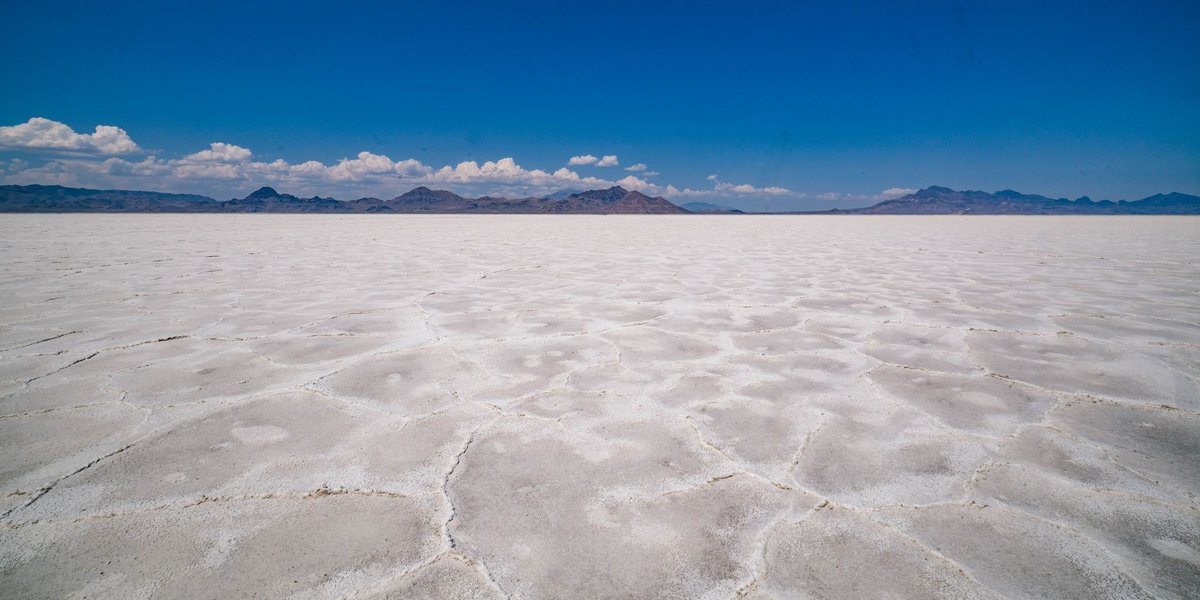
Botswana Ash (Botash) mines natural soda ash from brine beneath the Sua Pan, part of the Makgadikgadi salt pan system — one of the largest salt flats on the planet. Output is modest next to the US or Türkiye, but it’s enough to supply glass and detergent manufacturers across Southern Africa without competing on the same playing field as the giants, and natural production keeps its costs low relative to synthetic alternatives that would otherwise have to be imported into the region.
8. Kenya — one of the oldest natural sites still running
Tata Chemicals Magadi has been drawing natural soda ash from Lake Magadi, a soda lake in Kenya’s Rift Valley, for more than a century, making it one of the longest continuously operating natural soda ash sites anywhere. Output is small on a global scale, but the operation is a reminder that East Africa’s rift lakes are geologically similar to the deposits that make Wyoming and Türkiye competitive — the region just hasn’t been developed at the same scale.
Production at a Glance
| Country | Approx. Share of Global Output | Primary Method | Key Deposit / Facility |
|---|---|---|---|
| China | ~45–50% | Synthetic (Solvay/Hou), growing natural | Alashan, Inner Mongolia |
| United States | ~15–17% | 100% natural | Green River Basin, Wyoming |
| Türkiye | Rapidly growing, mid-single digits and climbing | Natural | Beypazarı / Kazan trona basin |
| India | Low-to-mid single digits | Mostly synthetic | Mithapur, Gujarat |
| Russia | Low-to-mid single digits | Synthetic | Sterlitamak (Bashkir Soda) |
| Bulgaria | Low single digits | Synthetic | Devnya (Solvay Sodi) |
| Botswana | Under 1% | Natural | Sua Pan (Makgadikgadi) |
| Kenya | Under 1% | Natural | Lake Magadi |
These are directional shares based on industry production patterns, not audited figures — soda ash trade data is notoriously fragmented across national statistics agencies, and China in particular doesn’t publish granular export-vs-domestic breakdowns. For sourcing decisions, treat this as a starting map, not a substitute for a supplier’s own production data. The USGS National Minerals Information Center tracks US and global soda ash statistics annually and is the most reliable public benchmark for tonnage trends.
What’s Pulling Demand Higher Right Now
Flat glass and detergents have been soda ash’s bread and butter for over a century, and they still account for most global consumption. But two newer demand drivers are changing how producers plan capacity.
Lithium extraction. Soda ash is used to precipitate lithium carbonate out of brine during battery-grade lithium processing — a step in the supply chain that barely mattered a decade ago and now matters enormously as EV battery manufacturing scales up. Lithium producers need reliable, high-purity soda ash supply, and that’s pulled new demand into a market that used to be driven almost entirely by construction and packaging cycles. The USGS lithium statistics program tracks this buildout in detail, and the trajectory only points one direction.
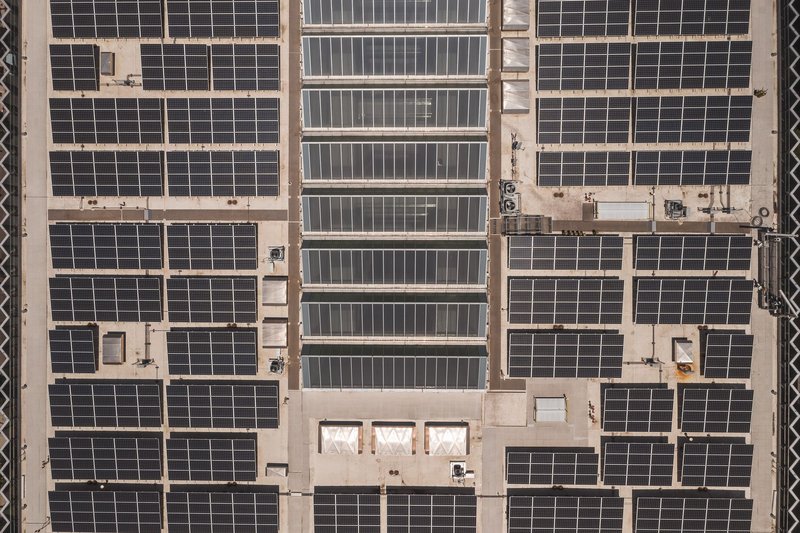
Solar glass. Photovoltaic panels need low-iron flat glass, and that glass needs soda ash — a lot of it, since solar glass manufacturing has scaled alongside the broader renewable buildout, concentrated heavily in China. This is part of why Chinese domestic soda ash demand has stayed strong even as some traditional glass segments have cooled: solar has picked up the slack and then some.
Neither driver shows up in most of the older market reports still circulating online, which is exactly why sourcing decisions based on five-year-old demand assumptions tend to underestimate where the market’s actually headed.
The Deposits Nobody’s Tapped Yet
Not every natural deposit gets mined. Lake Natron in northern Tanzania sits on one of the largest untapped soda ash resources in East Africa, and proposals to develop it have surfaced repeatedly over the years — and been blocked repeatedly, because the lake is the primary breeding site for roughly three-quarters of the world’s lesser flamingo population. It’s a useful reminder that geological potential and commercial development don’t always line up; some of the richest deposits on the map will probably stay exactly where they are.
That tension is likely to keep shaping where new capacity actually gets built. The countries with room to expand natural production without running into an environmental or political wall — Türkiye most visibly, with China’s Inner Mongolia deposits close behind — are the ones positioned to take share over the next decade, while everyone else keeps competing on synthetic capacity and proximity to the buyer.