A weather front is the boundary between two air masses with different temperatures, humidity, and densities — and it’s almost always where the interesting weather happens.
Most explanations stop there and give you a textbook rundown. This one ties each front type to a real event or place where you can actually picture it, then shows you how to read the sky before a front arrives.
Table of Contents
- The Four Main Types of Weather Fronts
- Cold Fronts
- Warm Fronts
- Stationary Fronts
- Occluded Fronts
- Two More Worth Knowing: Dry Lines and Arctic Fronts
- Quick Comparison Table
- How to Spot an Approaching Front
The Four Main Types of Weather Fronts {#the-four-main-types}
Meteorologists recognize four canonical front types — cold, warm, stationary, and occluded. Each one forms differently, produces different weather, and carries its own symbol on a weather map. They all share one thing: the air on each side wants to stay separate, and the boundary between them is unstable enough to generate wind, clouds, and precipitation.
A fifth and sixth type — dry lines and arctic fronts — don’t appear in every textbook but are common enough in North America that they’re worth understanding.
Cold Fronts {#cold-fronts}
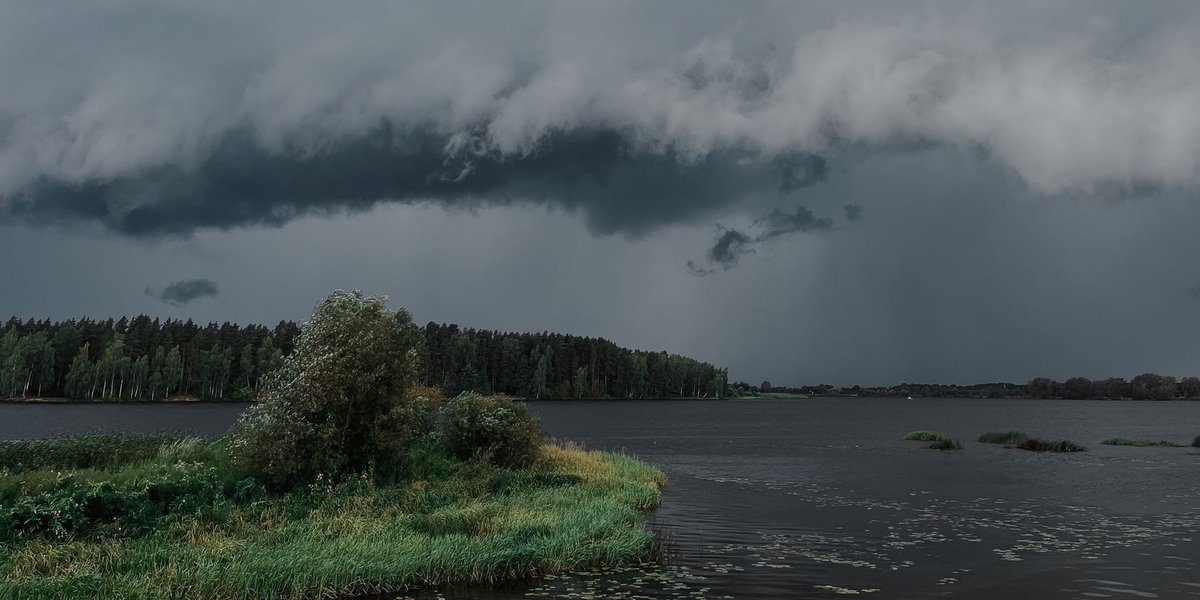
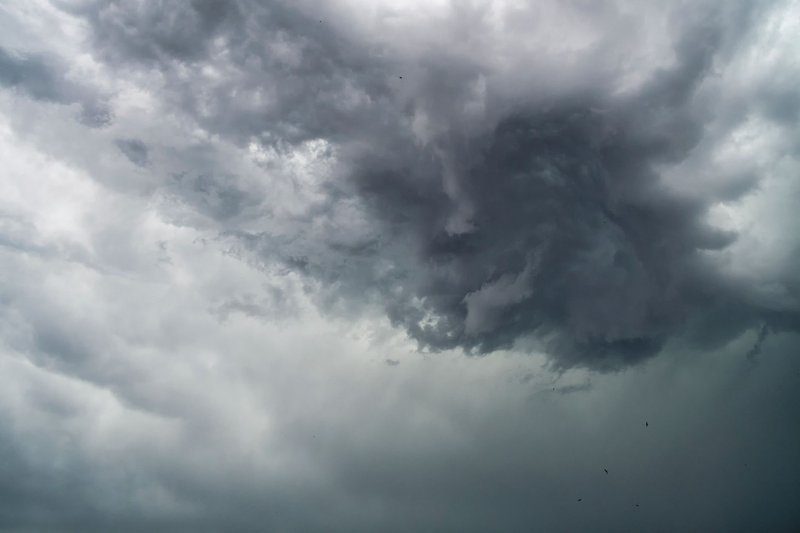
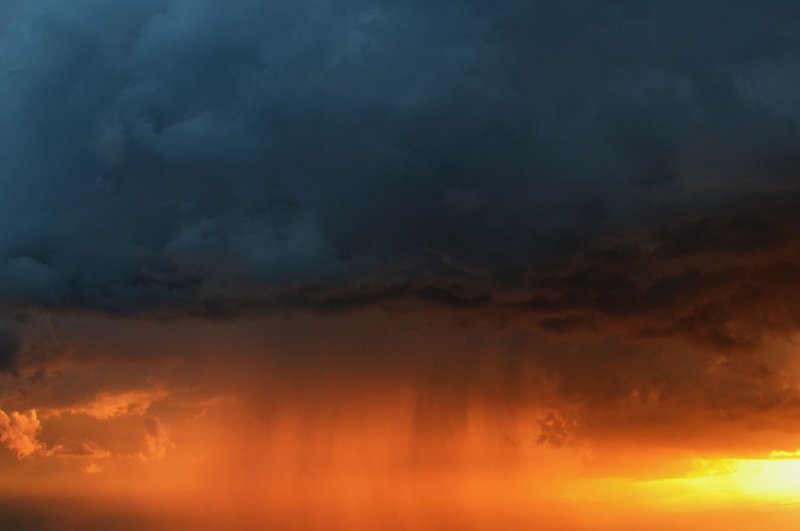
A cold front forms when a mass of cold, dense air pushes into a region occupied by warmer, lighter air. Because cold air is heavier, it slides underneath the warm air and shoves it upward rapidly. That forced ascent is why cold fronts tend to produce the most dramatic weather of the four types.
What the weather looks like: A line of cumulonimbus clouds, heavy rain or hail, strong and gusty winds, and sometimes tornadoes. The whole event can pass through in a few hours. Once the front moves through, temperatures drop noticeably — sometimes 10–20°F in a matter of hours — and the sky clears to a sharp blue.
On a weather map: A solid blue line with solid triangles pointing in the direction of movement.
How long it lasts: The active weather band is narrow, usually 50–100 miles wide, and moves through quickly. The post-frontal clearing can last days.
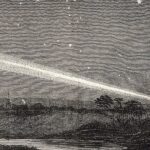
Real-world example: The “Outbreak of April 3–4, 1974” remains one of the most studied cold front events in U.S. history. A powerful cold front sweeping from the Gulf States into the Ohio Valley triggered 148 tornadoes in 18 hours, killing more than 300 people across 13 states. The Midwest spring tornado season — those high-drama days in April and May when the sky turns green — is almost always a cold front pushing into warm, moist Gulf air. Cold fronts are just one entry in a much broader catalog of weather phenomena that span everything from fog and heatwaves to the most violent storms on record.
Warm Fronts {#warm-fronts}
A warm front is the leading edge of a warmer air mass advancing into cooler territory. Unlike a cold front, warm air can’t bulldoze its way in — it’s less dense. Instead, it rides up and over the cooler air ahead of it at a very shallow angle, sometimes spreading across hundreds of miles before precipitation reaches the ground.
What the weather looks like: Hours of gradual buildup. First high, thin cirrus clouds appear (the classic “mare’s tails”), then the sky thickens into a gray overcast. Light, steady rain or drizzle follows, sometimes for a full day or two. After the front passes, temperatures and humidity both rise, winds shift to the south or southwest, and visibility improves.
On a weather map: A solid red line with solid semicircles pointing in the direction of movement.
How long it lasts: The precipitation can last 12–24 hours or longer. The approach, from first clouds to rain, can span a full day.
Real-world example: Pacific warm fronts rolling into the Pacific Northwest in November and December are textbook. A warm air mass from the central Pacific slides northeastward, overrunning the cold Canadian air parked over Washington and Oregon. Seattle gets two days of gray skies and persistent drizzle — not dramatic, just relentless. The temperature climbs slowly as the front passes. Portland residents recognize this pattern by the cirrus clouds appearing over the Coast Range the morning before rain arrives.
Stationary Fronts {#stationary-fronts}
A stationary front is exactly what the name implies: a boundary between two air masses that has stalled. Neither side has enough push to displace the other, so the front sits in place, sometimes for days.
What the weather looks like: Prolonged overcast, persistent light rain or drizzle along and just ahead of the boundary. Because the front isn’t moving, the same areas get rained on repeatedly. This is how multi-day floods happen in spring and early summer.
On a weather map: Alternating red semicircles and blue triangles pointing in opposite directions — one set toward each air mass. If you see that pattern sitting over the same state two days in a row on a forecast map, expect the rain to stay.
How long it lasts: Days. Sometimes more than a week. They often eventually become warm or cold fronts again when one air mass strengthens and starts moving.
Real-world example: The catastrophic Kentucky and Tennessee flooding of July 2022 was driven largely by a stationary front that parked over the region for days, repeatedly funneling moisture northward from the Gulf of Mexico. Some areas received over 14 inches of rain in 48 hours according to the National Weather Service. The front wasn’t moving — so neither was the rain.
Occluded Fronts {#occluded-fronts}
Occluded fronts are the most complex of the four. They form late in the life cycle of an extratropical cyclone, when a cold front catches up to a slower-moving warm front. The cold front undercuts the warm air and lifts it completely off the ground. The result is a three-way boundary: cold air behind, cooler air ahead, and a pocket of warm air aloft.
What the weather looks like: Mixed. You can get heavy rain, strong winds, and then a slower clearing as the system spins down. The weather isn’t as violent as a cold front but isn’t as mild as a warm front — it sits somewhere between both.
On a weather map: A purple line with alternating triangles and semicircles on the same side, both pointing in the direction of movement.
How long it lasts: The occlusion process usually signals a weakening storm. The active weather can last 6–12 hours, after which the system dissipates.
Real-world example: The Great Blizzard of 1978 that hit New England and the Great Lakes was a mature extratropical cyclone with an occluded front at its center. By the time the storm peaked over Massachusetts, the warm air had been lifted well aloft — but the moisture and cold air trapped in the system produced 27–40 inches of snow in parts of New England. Occluded fronts often accompany the most intense nor’easters that hit the U.S. East Coast in winter. For a broader look at how these systems fit into the full spectrum of severe weather, the list of storms is a useful reference covering everything from nor’easters and blizzards to tropical cyclones.
Two More Worth Knowing: Dry Lines and Arctic Fronts {#two-more-worth-knowing}
Dry lines aren’t temperature boundaries — they’re moisture boundaries. Dry, hot air from the high desert of the Southwest collides with humid Gulf air over the southern Great Plains, especially Texas, Oklahoma, and Kansas. No cold air involved. The sharp moisture gradient triggers severe thunderstorms and tornadoes, particularly in late spring. Tornado Alley owes much of its reputation to dry line activity. On a weather map, a dry line appears as a brown or orange dashed line.
Arctic fronts are cold fronts, but the air behind them comes directly from the Arctic, not just the northern continental interior. The temperature drop is more extreme — an arctic front passage in January can send temperatures from the 40s to below zero (°F) overnight across the northern Plains. The Polar Vortex disruption events of 2019 and 2021, which sent arctic air deep into Texas and the Midwest, were driven by arctic air masses surging south ahead of a deep arctic front.
Quick Comparison Table {#quick-comparison-table}
| Front Type | Symbol | Weather Produced | Duration | Real-World Example |
|---|---|---|---|---|
| Cold Front | Blue line, solid triangles | Thunderstorms, heavy rain, rapid temperature drop | Hours | April 1974 Tornado Outbreak (U.S.) |
| Warm Front | Red line, solid semicircles | Steady drizzle, gradual warm-up, cirrus clouds first | 12–24+ hours | Winter rain events, Pacific Northwest |
| Stationary Front | Alternating red/blue symbols, opposite directions | Prolonged overcast, persistent rain, flood risk | Days | Kentucky/Tennessee flooding, July 2022 |
| Occluded Front | Purple line, mixed symbols | Mixed precipitation, wind, then slow clearing | 6–12 hours | New England Blizzard of 1978 |
| Dry Line | Brown/orange dashed line | Severe thunderstorms, tornadoes | Afternoon peak, resets daily | Texas–Oklahoma tornado season |
| Arctic Front | Like a cold front, more extreme | Extreme temperature crashes, ice storms | Hours, but effects last days | U.S. Polar Vortex events, 2019/2021 |
How to Spot an Approaching Front {#how-to-spot-an-approaching-front}
You don’t need a weather app to recognize a front is coming. The atmosphere gives you a pretty clear sequence of signals.
For a warm front approaching:
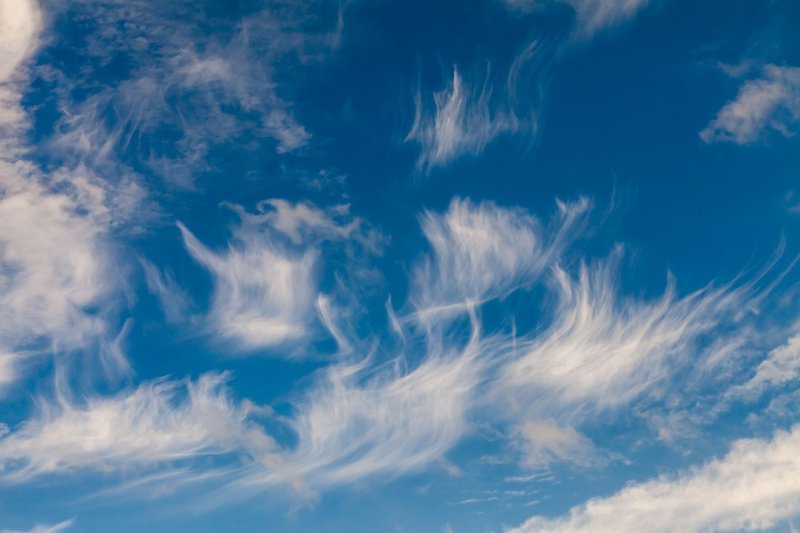
- High, wispy cirrus clouds appear 12–24 hours out, often with a solar or lunar halo — caused by ice crystals in those upper clouds. Cirrus belong to the high-level cloud family; if you want to know the other cloud types that share their altitude range, the list of mid-level clouds breaks down what follows as the front lowers toward you.
- The sky gradually lowers and thickens into gray alto- and stratus clouds over the following hours.
- Winds pick up from the south or southeast and the air feels more humid before rain starts.
For a cold front approaching:
- The day before: unusually warm, humid, and hazy. Cumulus clouds grow vertically in the afternoon.
- Hours before arrival: a sharp line of cumulonimbus towers on the western horizon.
- Winds shift — often dramatically — and the barometric pressure drops fast, then rises rapidly after the front passes.
The pressure trick: If you have an old barometer (or a weather app with pressure trend data), a falling barometer means a front is approaching. A rapidly rising pressure after a storm means the cold front has passed. Sailors and pilots have used this for centuries — the underlying physics hasn’t changed.
Understanding weather fronts doesn’t take years of meteorology coursework. The four main types cover the vast majority of weather events you’ll ever experience, and once you’ve tied each one to a real event, the abstract definitions start to stick. The next time a line of thunderstorms rolls in from the west, you’ll know exactly what’s driving it.