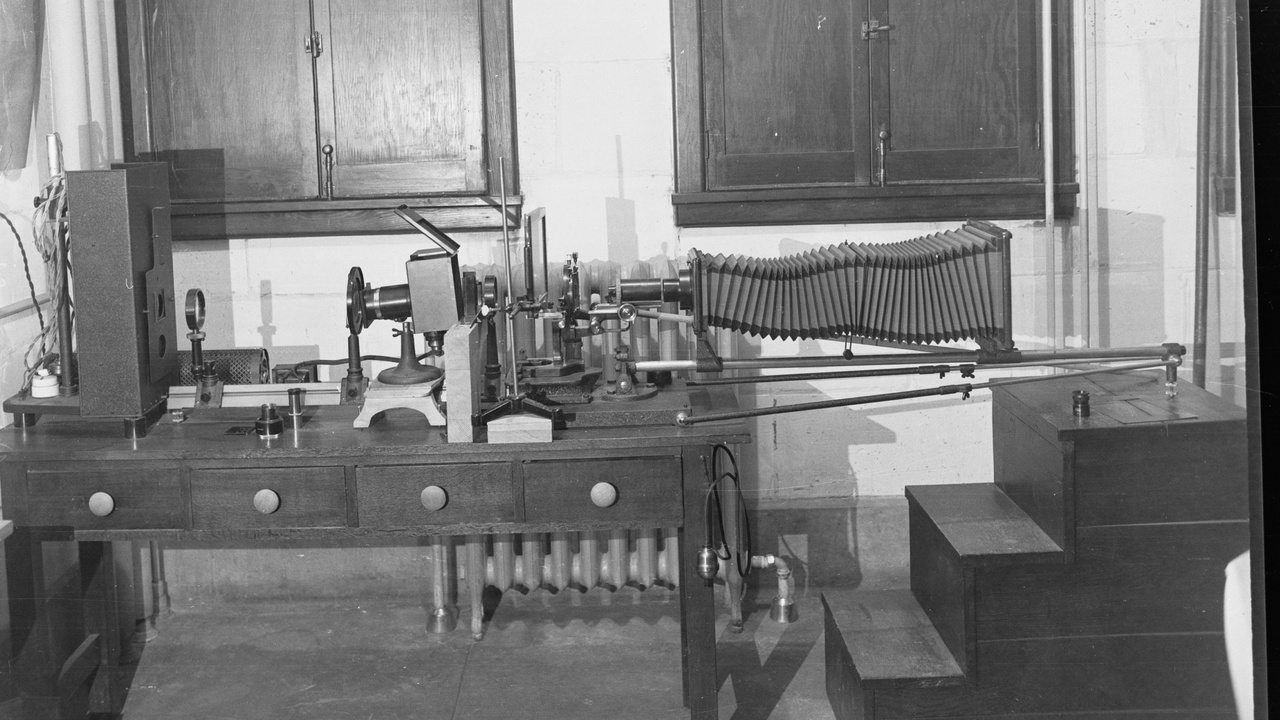
In 1953, when Watson and Crick proposed the double-helix structure of DNA, that leap depended on instruments: Rosalind Franklin’s X-ray diffraction photos and early microscopes made the shape visible. Scientific breakthroughs often look like ideas on paper, but they rest on hardware that measures, separates, and images the small and fast.
Most people see a gel band or a sequencing report and assume the result fell from nowhere. The reality is a toolkit of repeatable machines and methods. Modern labs turn raw samples into data through careful measurement, and labs rely on reliable biochemistry lab equipment to make that possible.
Below are ten core instruments, grouped by role, with plain examples of what they do, typical specs, and why they matter for research or the clinic.
Essential bench instruments
These everyday tools handle, measure, and read small samples. Precision at the bench underpins every downstream experiment: a poorly calibrated pipette or a slow centrifuge run can invalidate hours of work. Pipettes commonly advertise accuracy to about ±0.5–1% for mid-range volumes, bench centrifuges reach ~15,000 rpm (roughly 20,000 x g), and plate readers process 96-well plates in minutes. Labs expect consistent performance, routine calibration, and user training so measurements are reproducible across time and people.
1. Micropipettes — precision liquid handling
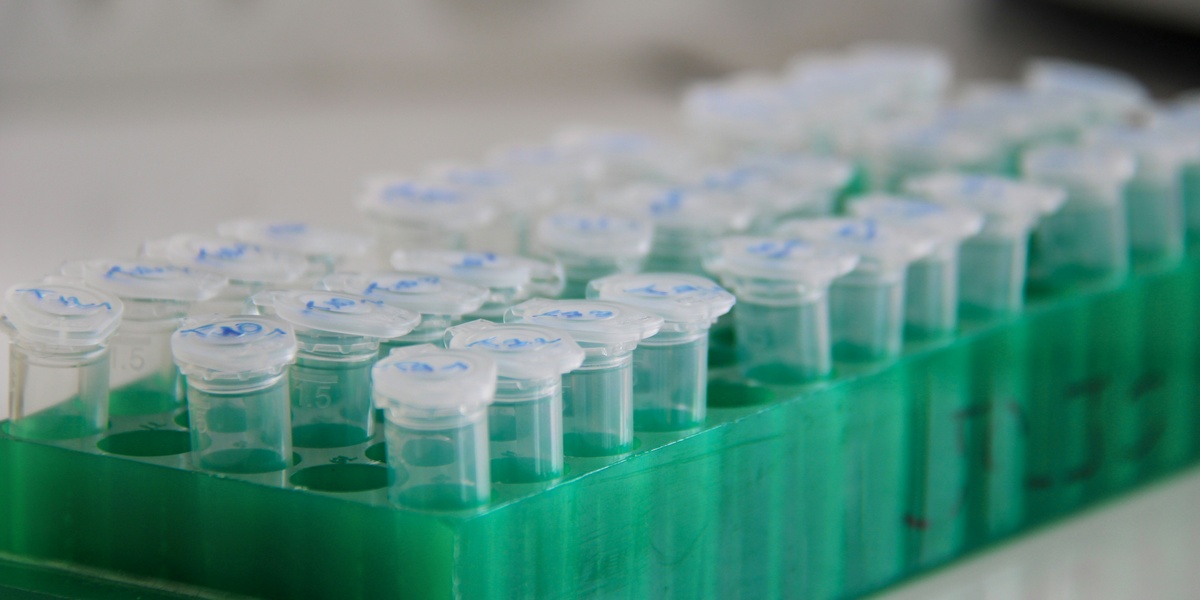
Micropipettes transfer microliter-to-milliliter volumes with precision for PCR setup, ELISAs, and HPLC sample prep. Typical single-channel ranges include P2, P20, P200, and P1000 (roughly 0.1 µL–1,000 µL overall), with advertised accuracies near ±0.5–1% at mid-range volumes. Multichannel pipettes speed plate work for 8 or 12 wells at once.
Common models include Eppendorf Research plus and Gilson PIPETMAN. Labs follow calibration schedules (often every 3–12 months) and watch for technique errors: wrong angle, pre-wetting omission, or using the wrong tips. Small volume errors compound quickly, so good pipetting is essential to reproducibility.
2. Centrifuges — separating by density and size
Centrifuges fractionate samples by sedimentation—pelleting cells, clarifying lysates, or resolving organelles. Bench-top units typically reach up to ~15,000 rpm (around 20,000 x g), while ultracentrifuges exceed 100,000 x g for ribosome or viral particle work. Rotor choice and balance matter for safety and results.
Typical instruments include the Eppendorf 5424 (bench-top) and Beckman Coulter Optima ultracentrifuges. A common protocol example: 10 minutes at 12,000 x g to pellet E. coli from culture. Always check rotor-rated limits and follow containment rules for biohazards.
3. Microplate readers — high-throughput readouts
Microplate readers read absorbance, fluorescence, and luminescence across 96- or 384-well plates. A 96-well absorbance read takes minutes; modern multimode readers offer kinetic reads and broad dynamic ranges for enzyme assays or cell viability tests. Detection modes let one instrument handle many assay types.
Typical platforms include BioTek Synergy (now Agilent) and Thermo Fisher Varioskan. Using 384-well plates reduces reagent volumes by roughly fourfold compared with 96-well formats and fits high-throughput screens and automated pipetting workflows.
Separation and basic analysis
Separation and spectroscopic instruments resolve components and give quantitative readouts. Reproducible chromatography retention times and absorbance values (for example, A260/A280 ratios for nucleic acids) are fundamental quality checks before deeper analyses like mass spectrometry or sequencing. Flow rates, wavelengths, and consistent sample prep determine whether a result is trustworthy.
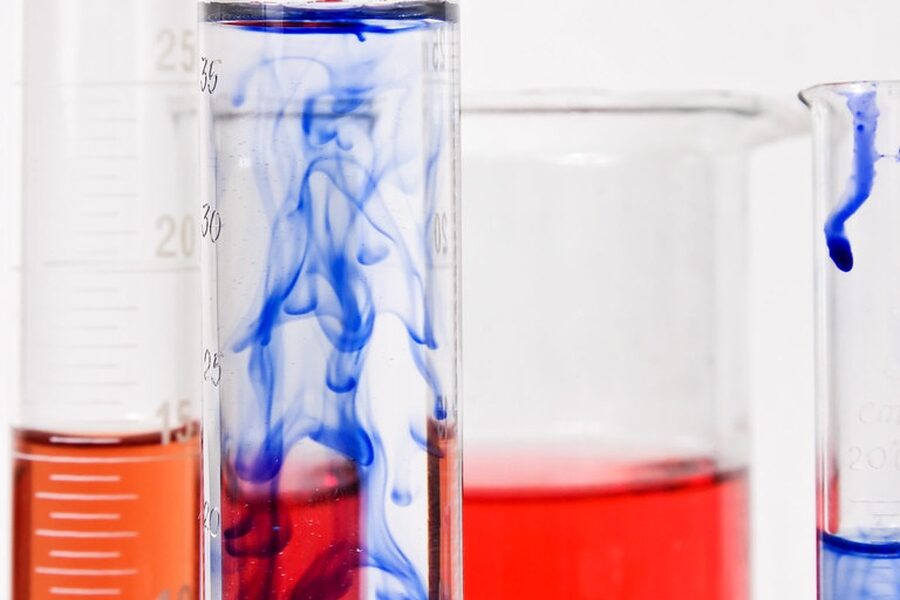
4. Spectrophotometers (UV–Vis) — quick concentration and purity checks
Spectrophotometers measure absorbance to quantify nucleic acids, proteins, and enzyme reactions. Common wavelengths are 260 nm for nucleic acids and 280 nm for proteins; the A260/A280 purity ratio benchmark is about 1.8–2.0 for pure DNA. The Beer–Lambert law converts absorbance to concentration with a known path length and extinction coefficient.
Small-volume instruments such as the Thermo Fisher NanoDrop One let you measure 1–2 µL samples quickly. Bench models like the Shimadzu UV-1800 offer cuvette-based measurements for kinetics and spectral scans.
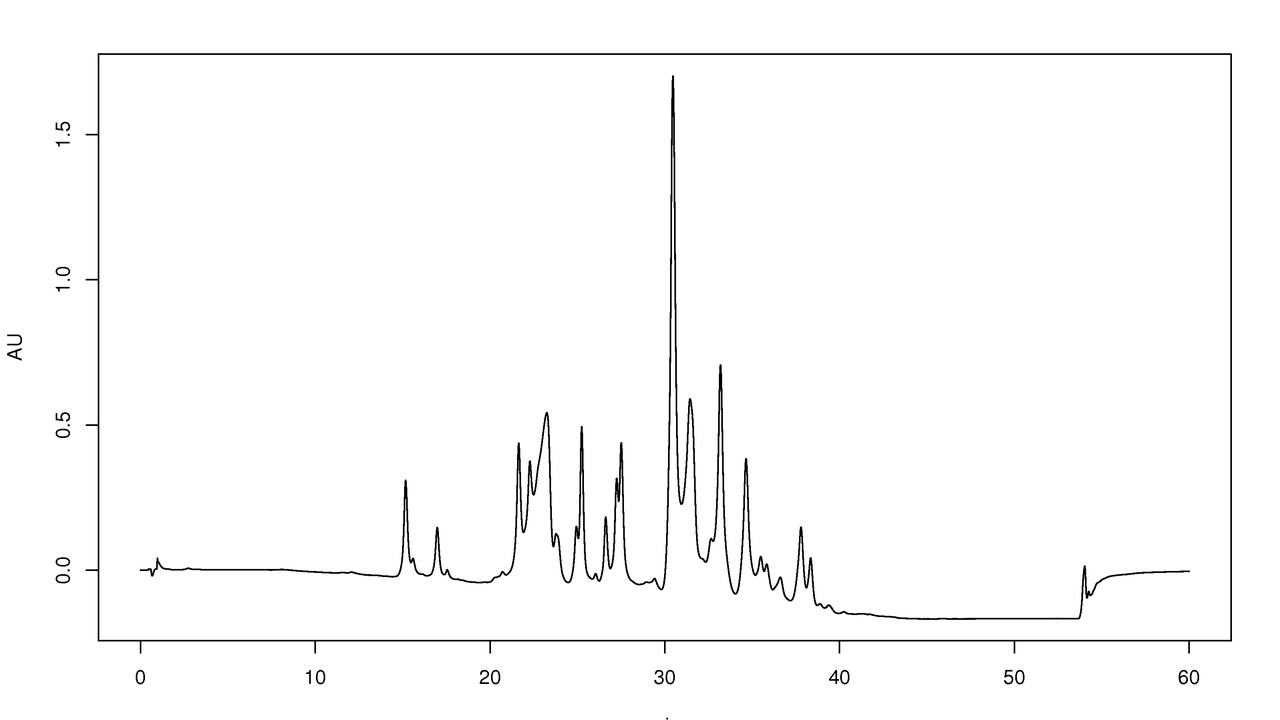
5. High-performance liquid chromatography (HPLC) — separating complex mixtures
HPLC separates small molecules, peptides, and sometimes proteins using packed columns and controlled flow. Analytical flow rates usually run 0.1–1.0 mL/min on C18 reverse-phase columns, and retention times serve as reproducible fingerprints for compounds. UPLC systems use smaller particles for faster, higher-resolution separations.
Popular systems include Agilent 1200/1260 series, Waters Acquity UPLC, and Thermo Scientific Vanquish. HPLC often couples to mass spectrometers (LC–MS) for identification. A typical run might use 0.5 mL/min on a C18 column to separate peptide mixtures for downstream MS analysis.
6. Gel electrophoresis systems — sizing and checking nucleic acids and proteins
Gel electrophoresis separates DNA, RNA, or proteins by size through agarose or polyacrylamide matrices. Agarose concentrations range from about 0.5% (large fragments) to 2% (small fragments). Run times typically span 30–90 minutes depending on voltage and gel size, and marker ladders provide size reference bands.
Common gear includes Bio-Rad Mini-Sub Cell systems and safe dyes like SYBR Safe for visualization (historically ethidium bromide). Use 0.8% agarose for large genomic fragments and 2% for resolving small PCR products.
Molecular amplification and sequencing
PCR and sequencing rewired what’s possible in biology. PCR, invented by Kary Mullis in 1983, can amplify a single DNA fragment billions of times, while next-generation sequencing (widespread in the mid-2000s) scales that reading process to millions or billions of short reads. The two technologies together enable diagnostics, surveillance, and discovery.
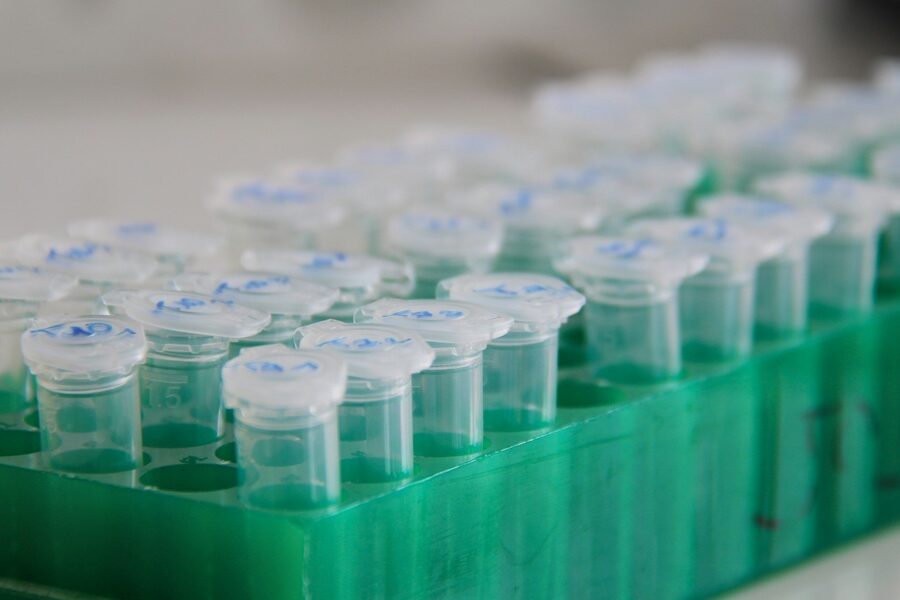
7. PCR thermocyclers — amplifying DNA and RNA (via RT–PCR)
Thermocyclers run programmed temperature cycles to denature, anneal, and extend DNA. Typical runs use 25–40 cycles and 10–50 µL reaction volumes. Real-time qPCR adds fluorescent probes or dyes to quantify starting template across cycles rather than relying on end-point detection.
Standard machines include Bio-Rad C1000 Touch and Applied Biosystems QuantStudio series. PCR is the backbone of diagnostic tests, cloning workflows, and gene expression assays. Proper primer design and cycle optimization determine specificity and yield.
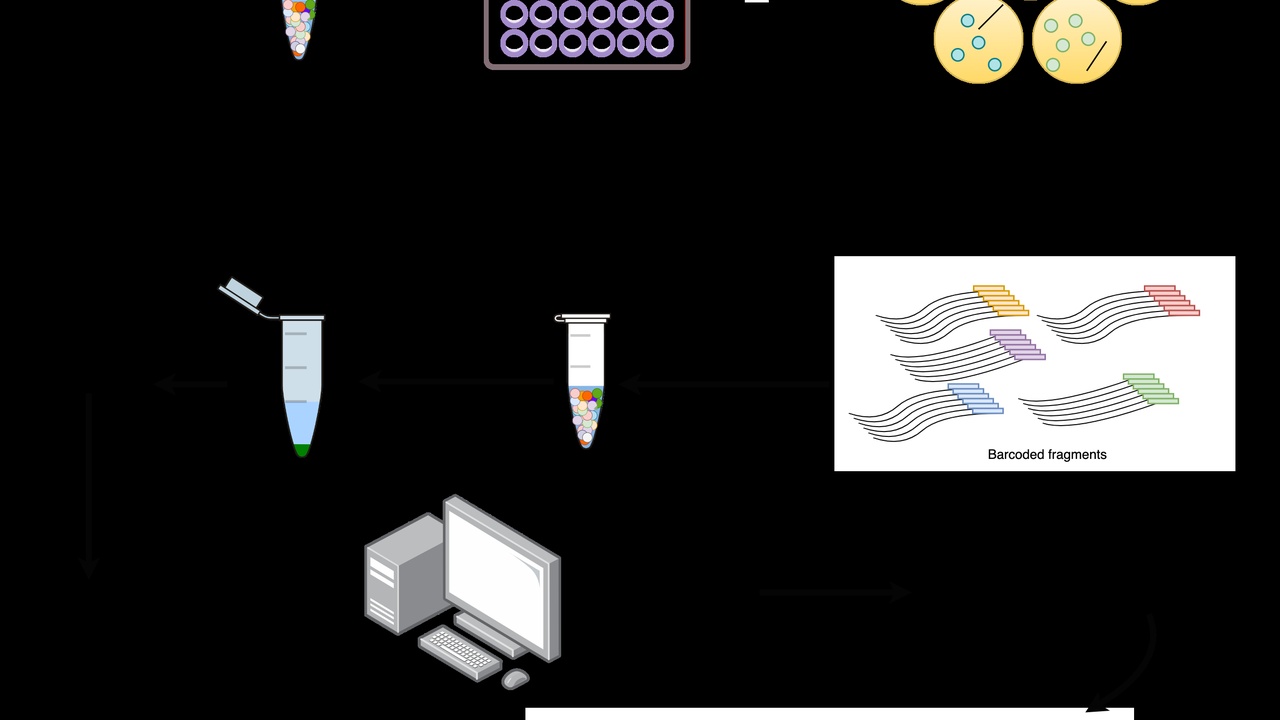
8. DNA sequencers — reading the genetic code at scale
Sequencers read DNA base-by-base. Traditional Sanger sequencing gives read lengths around 700–900 bases per run and remains useful for small-scale validation. Next-generation platforms (NGS) produce massive numbers of short reads, enabling whole genomes, exomes, and transcriptomes at scale; NGS became broadly available in the mid-2000s.
High-throughput systems like Illumina NovaSeq deliver millions to billions of short reads per run. Portable long-read devices such as the Oxford Nanopore MinION provide reads that can exceed tens of kilobases at the cost of higher per-read error rates. Choose Sanger for targeted, high-accuracy needs and NGS for breadth and depth.
High-end analytical and imaging platforms
These instruments reveal molecules and structures at high resolution and are usually housed in core facilities. They carry higher purchase and maintenance costs but provide data that simpler tools cannot—molecular identities, exact masses, and subcellular localization. Integration matters: HPLC feeds LC–MS, and careful sample prep affects imaging quality.
9. Mass spectrometers — identifying molecules by mass
Mass spectrometers measure mass-to-charge ratios to identify proteins, metabolites, and small molecules. High-resolution instruments report mass accuracy in parts-per-million (ppm); many modern Orbitrap and TOF systems achieve <5 ppm accuracy. Ionization sources include electrospray (ESI) and matrix-assisted laser desorption/ionization (MALDI).
Leading platforms include Thermo Fisher Orbitraps (Q Exactive family) and Bruker timsTOF or MALDI-TOF systems. Coupling LC to MS lets labs separate complex mixtures before mass analysis, powering proteomics, metabolomics, and clinical toxicology workflows.
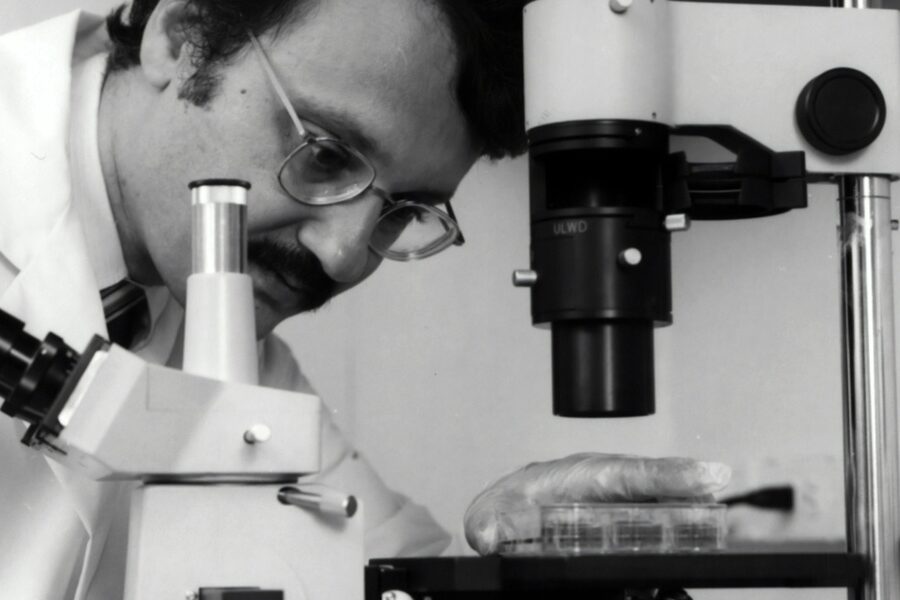
10. Light microscopes (brightfield, fluorescence, confocal) — from cells to subcellular structures
Microscopes visualize cells, tissues, and labeled molecules. Conventional optical resolution hits the diffraction limit at roughly 200 nm for visible light, but fluorescence and confocal imaging improve contrast and optical sectioning. Super-resolution methods push resolution below 100 nm for specialized studies.
Examples include Zeiss Axio Imager for widefield work and Leica SP8 confocal systems for high-resolution 3D stacks. Common labels are DAPI for nuclei and GFP for protein tagging. Microscopy supports cell biology, pathology, and developmental studies where spatial context matters.
Summary
Instruments translate samples into reliable data. From the humble micropipette to an Orbitrap mass spectrometer, each tool plays a specific role in the chain from experiment to discovery. Understanding them helps choose the right method for a question and improves reproducibility.
- Small tools matter: accurate pipetting and proper centrifugation are fundamental to reproducible results.
- Separation and spectroscopic checks (A260/A280, HPLC retention times) are quick quality gates before costly downstream work.
- Amplification and sequencing technologies (PCR since 1983, then NGS) scale sensitivity from single samples to population-level surveys.
- High-end platforms—mass spectrometers and confocal microscopes—provide molecular identity and spatial context that enable new discoveries.
- Use your institution’s core facilities, and get hands-on training (pipetting technique and routine instrument maintenance) to get the most from these tools and to understand the instruments used in biochemistry.