From mountain passes to coastal cities, weather affects how we live, work and travel every day. Knowing the kinds of events that can occur — and where and when they tend to happen — helps you prepare smarter, whether you’re planning a trip or managing local infrastructure.
There are 20 Examples of Weather Phenomena, ranging from Blizzard to Windstorm / Gale, chosen to show the full range of conditions people encounter. For each entry you’ll find below data organized as Type,Typical intensity (metric),Where (regions/season) so you can compare expected strength and typical locations or seasons at a glance — you’ll find those details below.
Which of these weather phenomena are most hazardous and when should I worry?
Hazard level depends on intensity and exposure: blizzards, hurricanes, tornadoes, flash floods and heatwaves regularly cause the most harm. Watch official alerts, note the Typical intensity (metric) for thresholds that trigger warnings, and consider local vulnerability (coastal flooding, mountain snowpack, urban drainage) to decide when to act.
How can I use the Type, Typical intensity (metric), Where columns to plan ahead?
Use the Type column to identify the event, Typical intensity (metric) to judge severity (wind km/h, rainfall mm/hr, temperature °C), and Where (regions/season) to learn timing and hotspots; together they help you choose routes, pack gear, and time activities around likely conditions.
Examples of Weather Phenomena
| Name | Type | Typical intensity (metric) | Where (regions/season) |
|---|---|---|---|
| Rain | precipitation | 1–50 mm/h | Worldwide; year-round, heavier in tropics |
| Snow | cryometeors | 0.5–5 cm/h | Mid–high latitudes; winter season |
| Freezing rain | precipitation | 0.1–10 mm/h | Temperate latitudes; winter and transition seasons |
| Sleet (ice pellets) | precipitation | 1–10 mm/h | Mid–high latitudes; winter |
| Hail | convective/storm | 0.5–10+ cm diameter | Mid-latitudes; spring–summer thunderstorms |
| Blizzard | convective/storm | Winds >40 km/h; visibility <0.4 km | Mid–high latitudes; winter storms |
| Thunderstorm | convective/storm | Gusts 50–120 km/h; rain 10–100 mm/h | Worldwide; warm season and afternoons |
| Tornado | convective/storm | 100–500 km/h (gusts) | Mid–low latitudes; spring–summer in many regions |
| Tropical cyclone (hurricane/typhoon) | convective/storm | 63–315 km/h sustained winds | Tropical/subtropical oceans; warm season |
| Lightning | convective/storm | Peak currents ~30,000 A; strike distances km | Worldwide with thunderstorms; warm season |
| Fog | hydrological | Visibility <1 km (fog) | Coasts, valleys, plains; night–morning and cool seasons |
| Dust storm / Haboob | wind | Visibility <1 km; winds 40–100 km/h | Arid/semi-arid regions; dry seasons |
| Windstorm / Gale | wind | Gusts 63–117 km/h | Mid-latitudes; extratropical cyclones, frontal passages |
| Derecho (straight-line windstorm) | convective/storm | Gusts 90–160 km/h | Mid-latitudes; warm season frontal convective lines |
| Heat wave | thermal | +5–10°C above normal for days–weeks | Mid–low latitudes; summer |
| Cold wave / Arctic outbreak | thermal | Temperature drops ≥5°C below normal; extremes vary | Mid–high latitudes; winter |
| Flash flood | hydrological | Runoff/rise within minutes–hours; rainfall >50 mm/h common | Hilly/urban regions; intense storms, monsoon seasons |
| Storm surge | hydrological | 0.5–10 m coastal water rise | Coastal regions; tropical cyclones and strong extratropical storms |
| Rainbow | optical | Primary angular radius ~42° | Worldwide after rain with sun low |
| Sun dog (parhelion)/halo | optical | 22° halo radius; bright spots at 22° | Mid–high latitudes; with cirrus/cirrostratus clouds |
Images and Descriptions

Rain
Liquid water droplets falling from clouds when air cools below dew point and condenses. Causes flooding, reduced visibility and travel disruption; common in warm fronts and convective storms. Notable: monsoon rains in India cause seasonal floods and crop impacts.
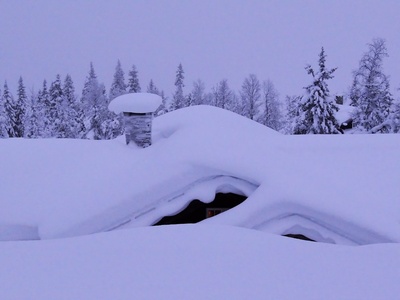
Snow
Ice crystals that grow in cold clouds and fall as flakes. Causes accumulation, transportation disruption, roof load and avalanches. Forms in cold, moist air and at frontal boundaries. Notable: 1998 North American blizzard produced widespread disruption and metres of drifting snow.
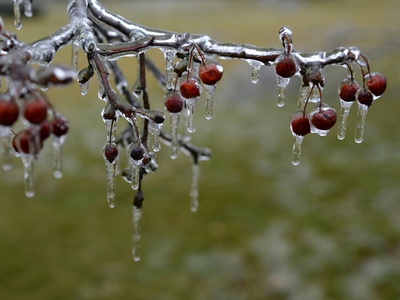
Freezing rain
Supercooled raindrops that freeze on contact with cold surfaces, creating glaze ice. Causes dangerous roads, power outages, and tree damage. Forms when a warm layer overlies a shallow subfreezing surface layer. Notable: 1998 North American ice storm.
Sleet (ice pellets)
Refrozen raindrops or partially melted snow that fall as small ice pellets. Causes slick roads and noise on roofs but typically less damaging than freezing rain. Occurs with shallow warm layers aloft over cold near-surface air.
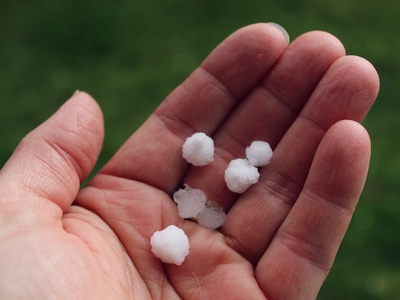
Hail
Frozen precipitation produced in strong thunderstorm updrafts where graupel and ice layers accrete. Hazards: crop and vehicle damage, injuries. Large hail (>5 cm) signals violent storms. Notable: 2010 Vivian, South Dakota 8-inch hail.
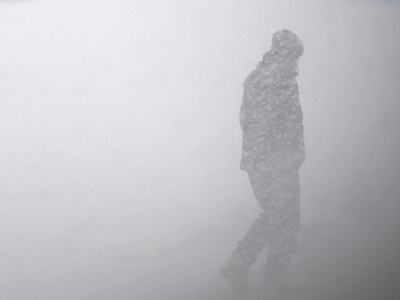
Blizzard
Severe winter storm combining heavy snow, strong winds and blowing snow that reduces visibility. Causes prolonged travel paralysis, exposure risk, and structural strain. Typically associated with intense low-pressure systems and cold air advection.

Thunderstorm
Rapidly developing convective storm with lightning, thunder, heavy rain, gusty winds and sometimes hail. Form from unstable, moist air and lift. Hazards: flooding, lightning fatalities, hail. Notable: derechos and severe multicell clusters.
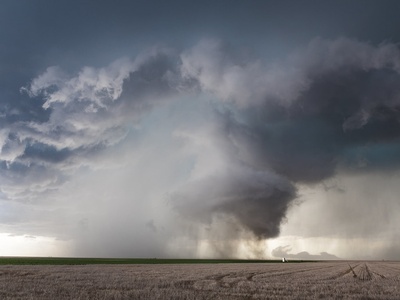
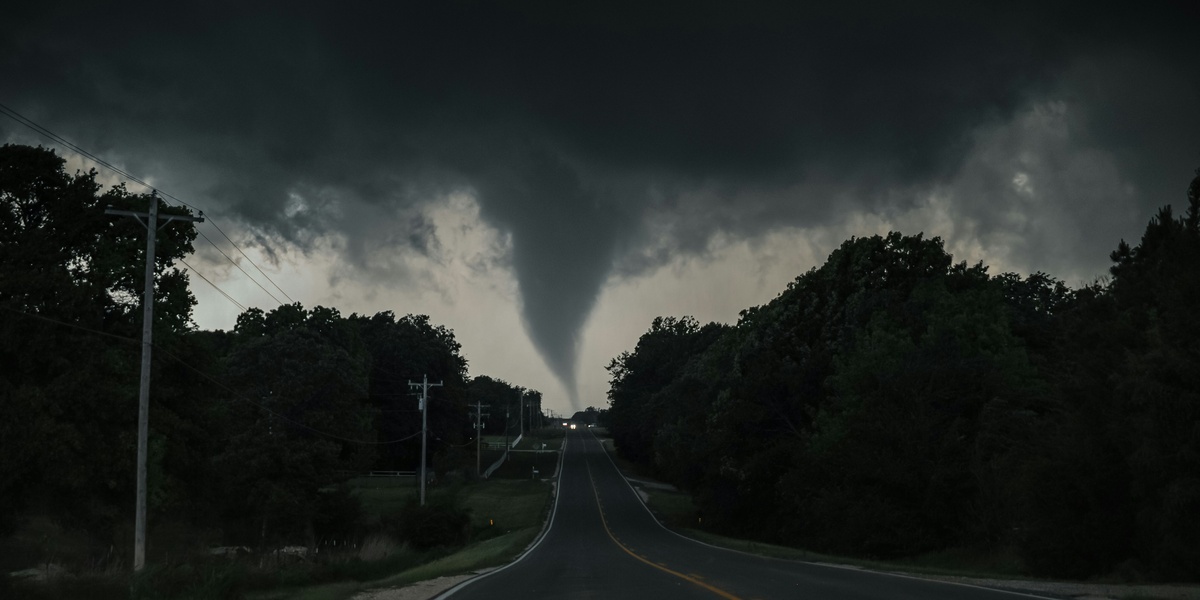
Tornado
Violently rotating column of air in contact with cloud and ground formed by strong wind shear and supercell thunderstorms. Causes localized extreme damage in narrow paths, debris risk, and fatalities. Notable: 2011 Joplin EF5 tornado.
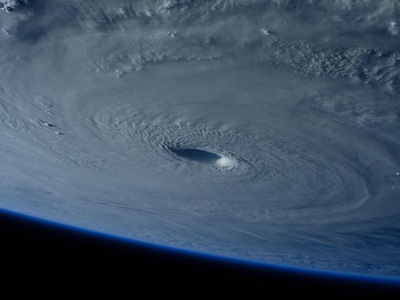
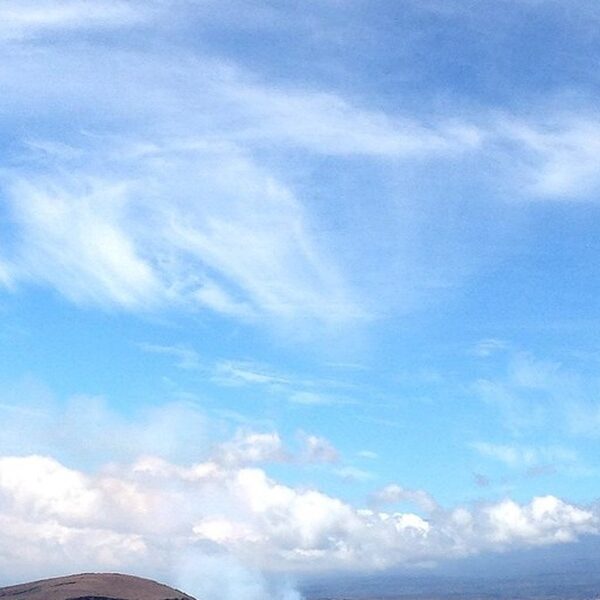
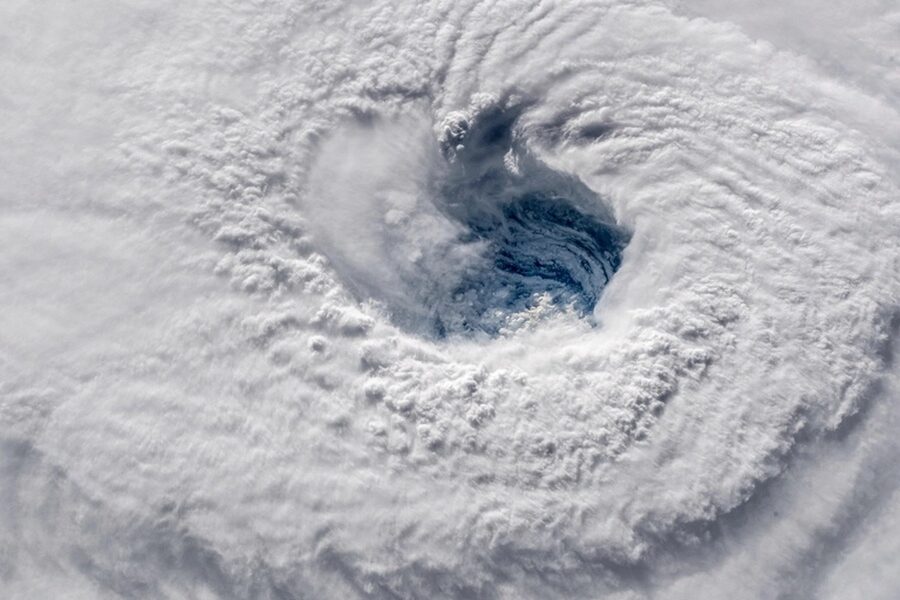
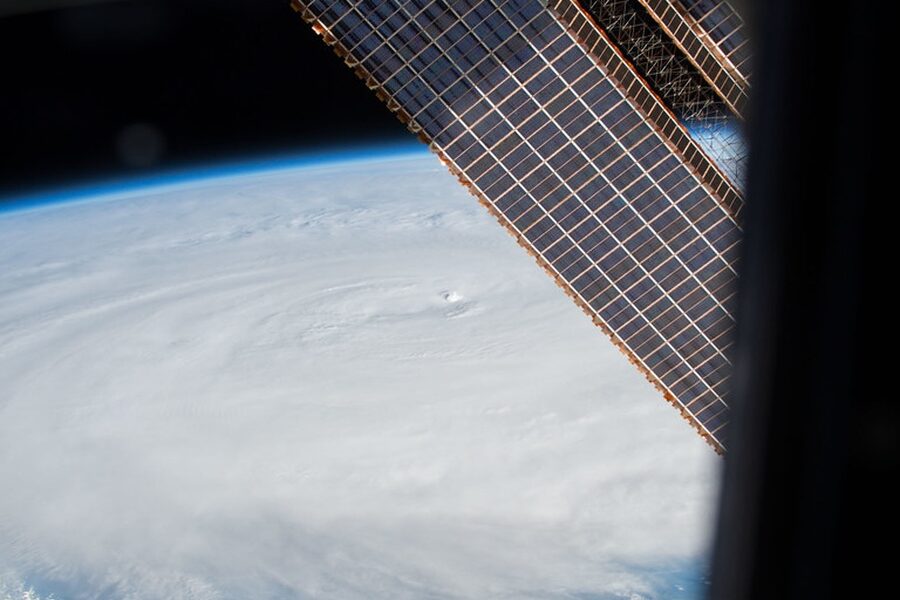
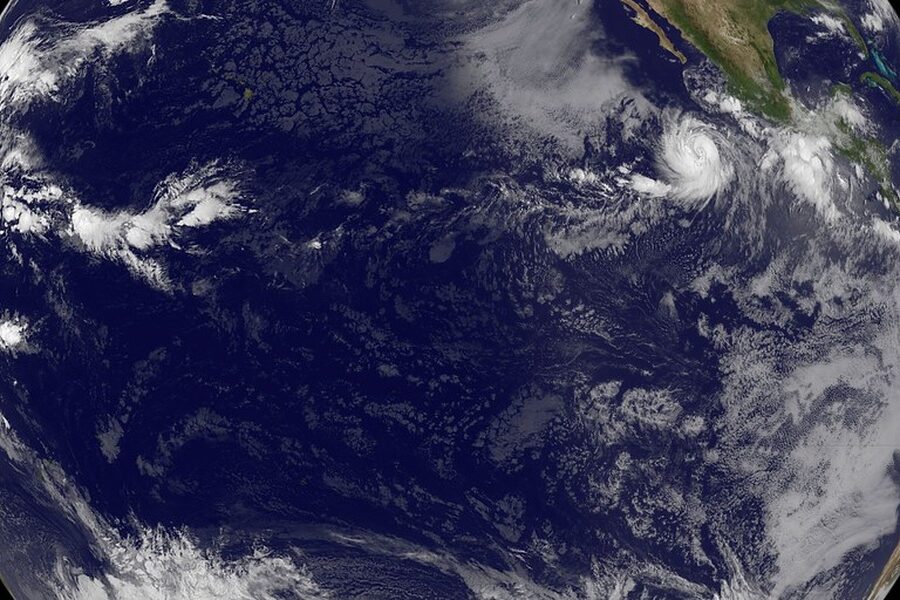
Tropical cyclone (hurricane/typhoon)
Large, organized low-pressure system fueled by warm ocean heat with strong winds, torrential rain and storm surge. Causes catastrophic coastal flooding, wind damage and widespread power outages. Notable: 2005 Hurricane Katrina.
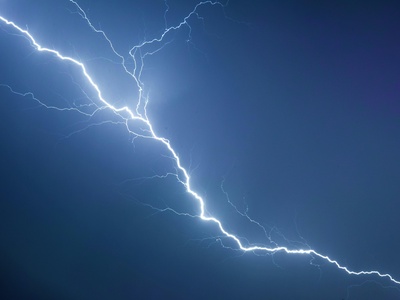
Lightning
Electrical discharge between clouds or cloud and ground produced by charge separation in storms. Hazards include fire, electrocution, and infrastructure damage. Can ignite wildfires and incapacitate electronics and aviation systems.
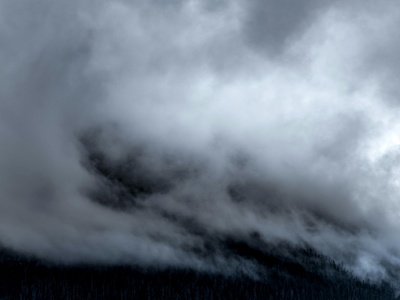
Fog
Suspended tiny water droplets near the surface that reduce visibility. Forms by cooling air to saturation or adding moisture; causes transportation delays, marine hazards, and accidents. Types include radiation, advection and upslope fog.
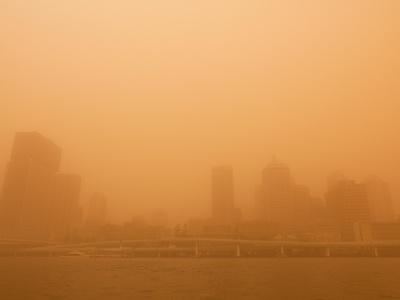
Dust storm / Haboob
Strong winds lift and carry dust and sand, drastically reducing visibility and air quality. Causes respiratory problems, traffic accidents, and infrastructure abrasion. Haboobs form from outflow boundaries of collapsing thunderstorms.
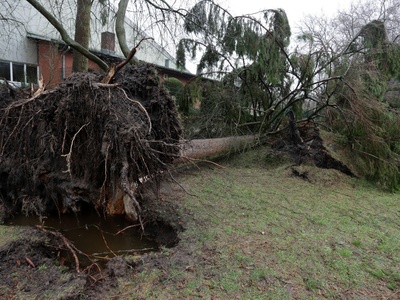
Windstorm / Gale
Strong, sustained winds from low-pressure systems or pressure gradients. Hazards: structural damage, fallen trees, transport disruption, coastal erosion. Common in temperate storm tracks and during intense cold or warm fronts.

Derecho (straight-line windstorm)
Long-lived convective system producing widespread, damaging straight-line winds from bowing thunderstorms. Causes large-area tree and structure damage similar to tornado outbreaks but with linear tracks. Notable: 2020 Midwest derecho.
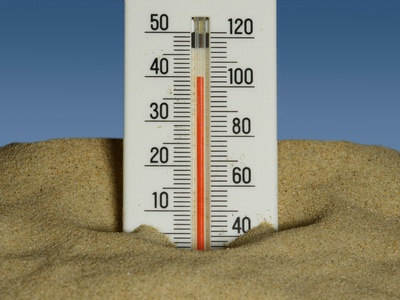
Heat wave
Extended period of unusually high temperatures often with humidity. Causes heat illness, increased mortality, energy demand, and drought stress. Driven by persistent high pressure and stagnant air. Notable: 2003 European heat wave.
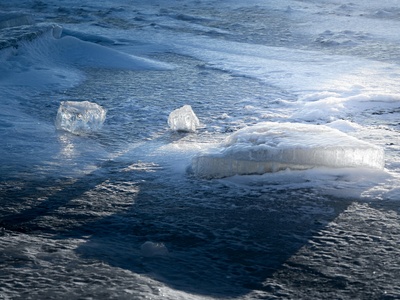
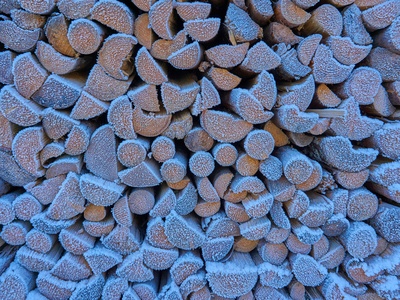
Cold wave / Arctic outbreak
Abrupt and prolonged ingress of very cold air from polar regions producing extreme low temperatures. Causes hypothermia, frozen infrastructure, energy strain, and transportation hazards. Notable: 2014 North American polar vortex events.
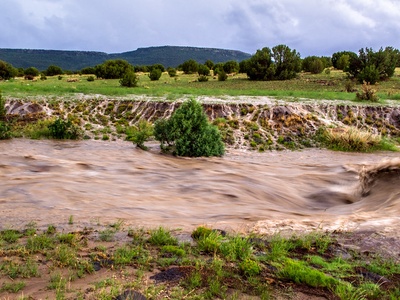
Flash flood
Rapid inundation from intense rainfall, dam/levee failure, or rapid snowmelt. Causes fatalities, vehicle washouts, and property loss. Often occurs downstream of convective storms or in burn-scar areas.
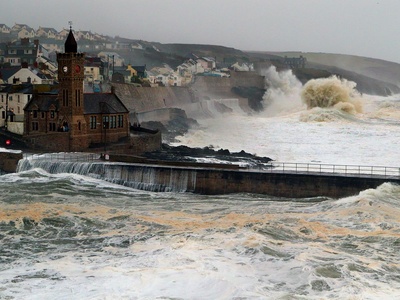
Storm surge
Abnormal rise of seawater driven by strong onshore winds and low pressure during storms. Causes coastal flooding, erosion, and infrastructure loss. Notable: 1970 Bhola cyclone and 2005 Hurricane Katrina surges.

Rainbow
Optical arc produced by refraction and internal reflection in raindrops, splitting sunlight into colors. Harmless and often visible opposite the sun; indicates moisture and sun angle. Common after showers when the sun is low on the horizon.
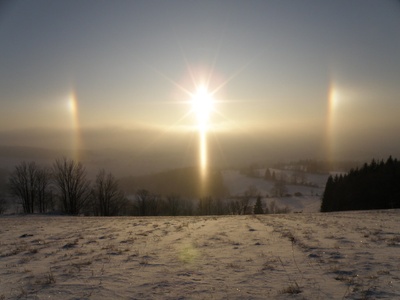
Sun dog (parhelion)/halo
Bright spots or rings around the sun caused by refraction through hexagonal ice crystals in high-altitude clouds. Useful indicator of incoming moisture and sometimes an approaching frontal system.