From mountain streams that feed farms to tidal estuaries by cities, what moves through our waterways shapes ecosystems, recreation and public health. Noticing changes — murky water, odd smells, fewer fish — helps communities act before problems worsen.
There are exactly 20 Water Pollution entries, ranging from Acid mine drainage (AMD) to Thermal pollution. Each entry is laid out using Category,Main pollutant or indicator,Primary sources / typical locations so you can quickly see causes and where they occur. For specific examples and context, you’ll find below.
How can I tell which type of pollution is affecting a local stream?
Look for visible signs (foam, discolored water, dead fish), odors, and habitat changes, then match them to common indicators—cloudiness (sediment), slicks (oil), low oxygen (organic overload), unusual temperature (thermal). Simple field tests for pH, nitrates and temperature plus a photo and location report to local authorities give the fastest clues.
What practical steps can residents take to reduce common water pollutants?
Start with source control: keep chemicals and pet waste out of drains, maintain septic systems, limit fertilizer use, and plant buffer strips to reduce runoff. Support local monitoring, report spills or fish kills, and join community cleanups—small, consistent actions cut pollution at its origin.
Water Pollution
| Name | Category | Main pollutant or indicator | Primary sources / typical locations |
|---|---|---|---|
| Nutrient pollution | Chemical | Nitrate NO3- (mg/L), Phosphate PO4 (mg/L) | Agricultural runoff, wastewater, stormwater, livestock operations |
| Agricultural runoff | Other | Nutrients, sediments, pesticides, bacteria (mixed indicators) | Cropland, livestock farms, irrigation drainage |
| Sewage / untreated wastewater | Biological | BOD (mg/L), fecal coliform/Enterococci CFU/100mL, nutrients | Municipal sewers, septic failures, combined sewer overflows |
| Pathogenic contamination (E. coli, Enterococci) | Biological | E. coli, Enterococci CFU/100mL (indicator bacteria) | Sewage, stormwater, animal waste, recreational areas |
| Harmful algal blooms (HABs) | Biological | Chlorophyll-a µg/L, algal toxins µg/L | Nutrient-rich waters, warm temperatures, stagnant water |
| Hypoxic zones / Dead zones | Biological | Dissolved oxygen mg/L (<2 mg/L indicates hypoxia) | Coastal waters, estuaries, river mouths with high nutrient input |
| Lead contamination | Chemical | Lead Pb (µg/L or ppb); US action level 15 µg/L | Corroded pipes, industrial discharge, legacy mining |
| Mercury contamination (Minamata) | Chemical | Methylmercury µg/L; fish tissue mg/kg (bioaccumulation) | Industrial discharge, coal combustion, artisanal gold mining |
| Arsenic contamination (groundwater Bangladesh) | Chemical | Arsenic As (µg/L); WHO guideline 10 µg/L | Natural geologic leaching, mining, industrial waste |
| PFAS (forever chemicals) | Chemical | PFAS (PFOA/PFOS) ng/L or ppt (parts per trillion) | Firefighting foams, industrial sites, wastewater treatment plants |
| Pesticides (Atrazine) | Chemical | Atrazine and pesticide residues µg/L | Agricultural application, runoff, spray drift |
| Oil spills (Deepwater Horizon) | Physical | Total petroleum hydrocarbons mg/L, oil sheen (visual indicator) | Offshore drilling, tanker accidents, pipeline leaks |
| PAHs (Polycyclic aromatic hydrocarbons) | Chemical | PAH concentration µg/L; sediment mg/kg | Combustion runoff, oil spills, industrial discharges |
| Solvents & VOCs (TCE, PCE, MTBE) | Chemical | TCE/PCE/MTBE concentration µg/L | Industrial spills, dry cleaning sites, fuel leaks, service stations |
| Acid mine drainage (AMD) | Chemical | Low pH, high sulfate and metal mg/L (Fe, Al, Mn) | Abandoned mines, active mining operations, tailings areas |
| Mining tailings dam failures (Samarco/Brumadinho) | Physical | Suspended solids mg/L, heavy metals mg/L in water | Tailings dams and storage facilities near rivers and valleys |
| Microplastics | Physical | Particles <5 mm; counts per m3 or per kg sediment | Plastic litter, synthetic textiles, cosmetics, tire wear in urban runoff |
| Sediment / turbidity | Physical | Total suspended solids mg/L; turbidity NTU | Construction sites, deforestation, agriculture, stream bank erosion |
| Thermal pollution | Thermal | Temperature increase °C; reduced dissolved oxygen mg/L | Power plants, industrial cooling water discharges into rivers and lakes |
| Radiological contamination (Fukushima) | Radiological | Radioisotopes Bq/L (e.g., Cs-137, I-131) | Nuclear accidents, contaminated runoff, waste leaks to surface/coastal waters |
Images and Descriptions

Nutrient pollution
Nutrient pollution from excess nitrogen and phosphorus fuels algal blooms, lowers oxygen, and harms fisheries and drinking water. Measurable by mg/L nitrates and phosphates; notable in Lake Erie and Gulf of Mexico; mitigation includes reduced fertilizer use and riparian buffers.
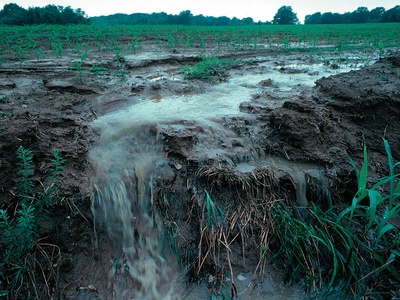
Agricultural runoff
Agricultural runoff carries fertilizers, manure, pesticides and sediment into rivers and lakes, raising nutrients, pathogens and toxins. It drives eutrophication, drinking-water contamination and habitat loss. Common in intensively farmed watersheds; mitigation includes cover crops, buffer strips and controlled drainage.
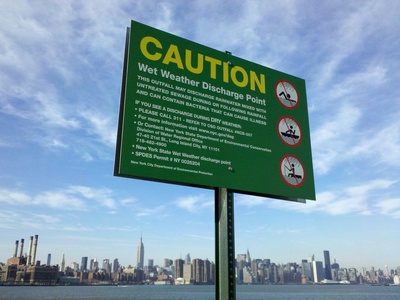
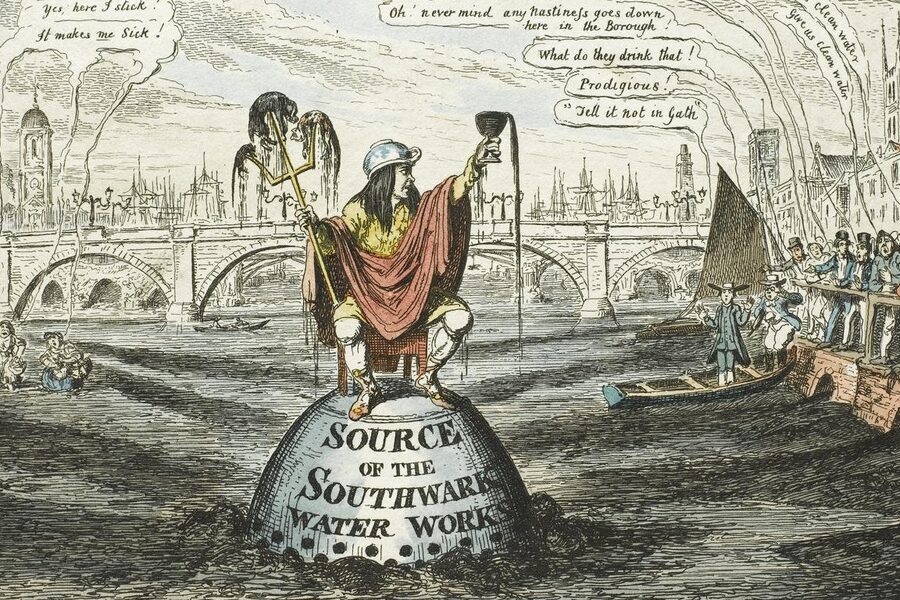
Sewage / untreated wastewater
Untreated or poorly treated sewage introduces pathogens, organic matter, nutrients and chemicals into water, raising BOD and causing oxygen depletion, disease outbreaks and beach closures. Measured by BOD mg/L and fecal coliform counts; mitigate by upgrading treatment, sewer repair and disinfection.
Pathogenic contamination (E. coli, Enterococci)
Pathogenic contamination means bacteria, viruses and protozoa in water causing gastrointestinal and other illnesses. Indicators include E. coli and Enterococci CFU/100mL; high counts close beaches and water supplies. Controls include sanitation, wastewater treatment, and reducing animal waste runoff.
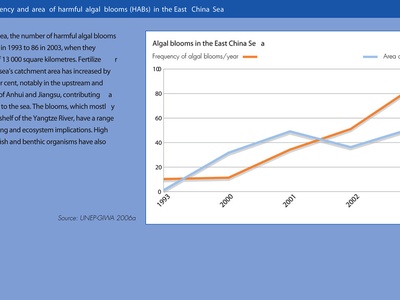
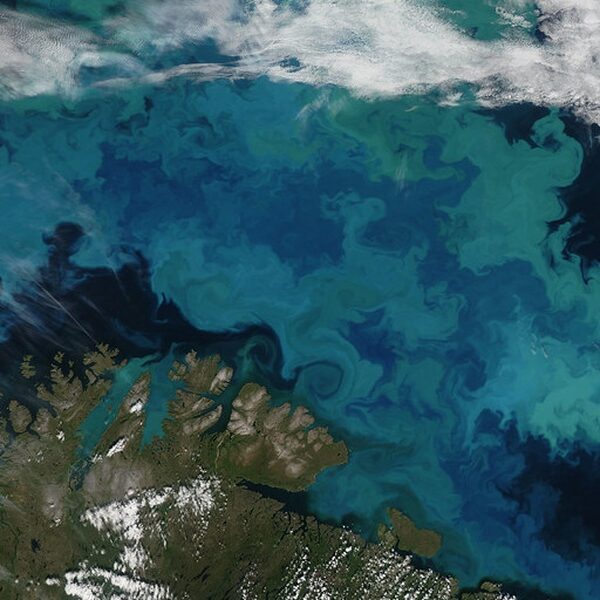
Harmful algal blooms (HABs)
Harmful algal blooms produce toxins and oxygen-depleting decay, threatening drinking water, fisheries, and recreation. Measured by chlorophyll-a and toxin concentrations; frequent in nutrient-rich lakes like Lake Erie and reservoirs. Mitigation: nutrient reductions, aeration, and early monitoring and advisories.
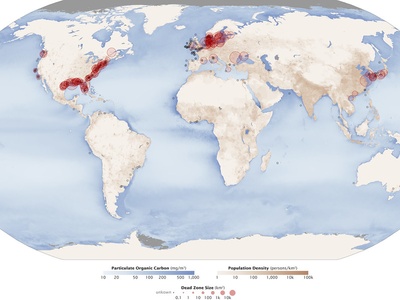
Hypoxic zones / Dead zones
Dead zones are low-oxygen areas where aquatic life cannot survive, caused by nutrient-fueled decomposition after blooms. Defined by DO below about 2 mg/L; notable in Gulf of Mexico. Prevent with upstream nutrient management, wetlands restoration, and wastewater upgrades.
Lead contamination
Lead in water arises from corroded plumbing, industrial wastes and historical mining, harming neurological development, especially in children. Measurable in µg/L; Flint, Michigan highlighted corrosion risks. Mitigation: corrosion control, pipe replacement, source control, and targeted filtration.
Mercury contamination (Minamata)
Mercury converts to methylmercury, bioaccumulates in fish and poses severe neurological risks, causing Minamata disease in Japan. Detected in fish tissue mg/kg or water µg/L. Reduce emissions, control industrial discharges, and advise seafood consumption limits to mitigate exposure.
Arsenic contamination (groundwater Bangladesh)
Arsenic in groundwater from geologic leaching and mining contaminates wells, causing skin lesions and cancer. Measured in µg/L with a 10 µg/L guideline. Prominent in Bangladesh and parts of South Asia. Mitigate through alternative water sources and filtration.
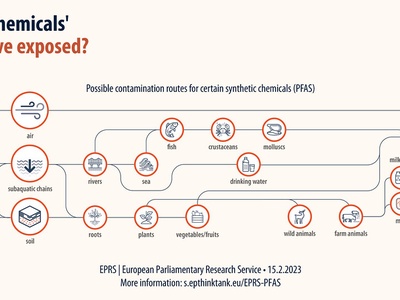
PFAS (forever chemicals)
PFAS are persistent, bioaccumulative synthetic chemicals found in drinking and surface waters, linked to health effects. Detected at ppt (ng/L) levels near manufacturing sites and military bases. Mitigation includes source cleanup, activated carbon or ion-exchange treatment and restricting use.
Pesticides (Atrazine)
Herbicides and insecticides like atrazine enter water via runoff and drift, harming aquatic life and affecting drinking water quality. Measured in µg/L; notable in corn-growing regions. Mitigation: precision application, buffer zones, integrated pest management and treatment where needed.
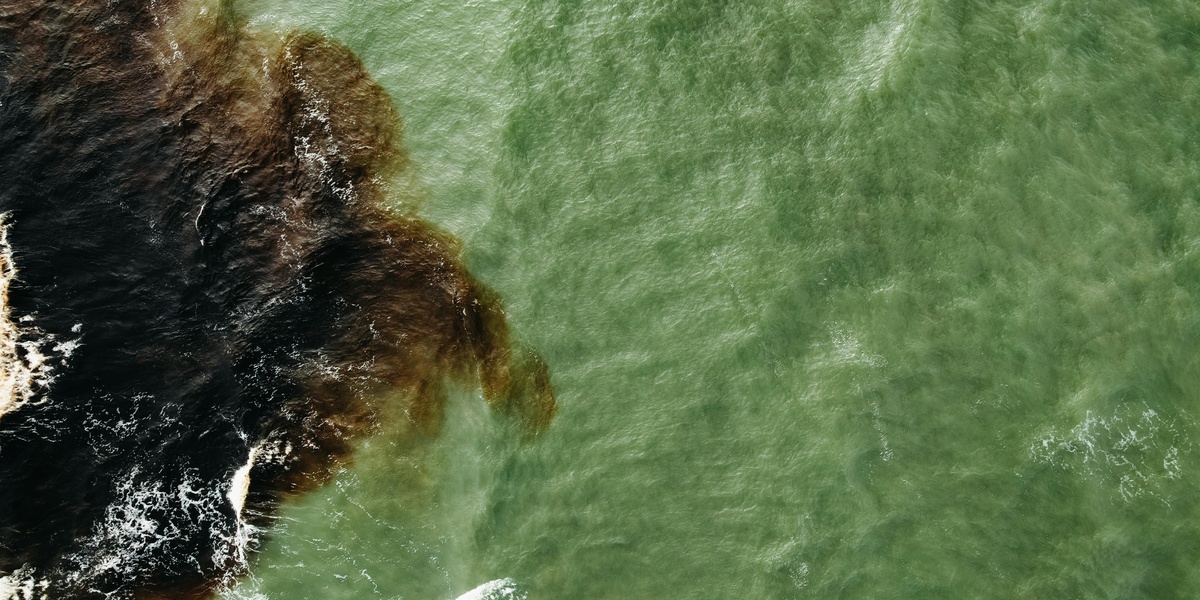
Oil spills (Deepwater Horizon)
Oil spills release crude oil and refined products into marine and coastal waters, coating wildlife, contaminating fisheries and shorelines. Measured by petroleum hydrocarbons mg/L and visual sheen. Deepwater Horizon (2010) exemplifies scale; mitigation includes containment, skimming, bioremediation and stricter safety.
PAHs (Polycyclic aromatic hydrocarbons)
PAHs form from incomplete combustion and oil inputs, accumulating in sediments and harming fish and benthic organisms; some are carcinogenic. Measured in water and sediment mg/kg. Reduce by controlling runoff, remediating sediments, and limiting industrial discharges.
Solvents & VOCs (TCE, PCE, MTBE)
Chlorinated solvents and fuel additives contaminate groundwater and surface water from spills and leaks, posing cancer and neurological risks. Measured in µg/L; common at industrial and dry-cleaning sites. Mitigation: source removal, monitored natural attenuation, and pump-and-treat systems.
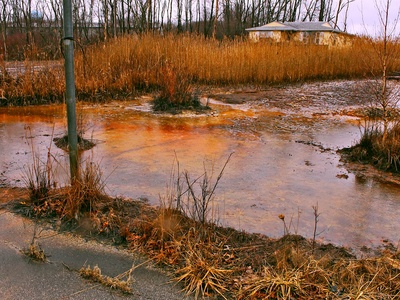
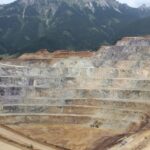
Acid mine drainage (AMD)
Acid mine drainage generates acidic, metal-rich waters from exposed sulfide minerals, killing aquatic life and contaminating drinking sources. Identified by low pH and elevated metal concentrations. Remediation includes neutralization, passive wetlands, and mine closure management.
Mining tailings dam failures (Samarco/Brumadinho)
Tailings dam collapses release tonnes of mine waste and slurry into rivers, killing ecosystems and contaminating water with sediment and metals. Samarco (Mariana, 2015) and Brumadinho (2019) devastated Brazilian waterways. Mitigate via dam safety, dry stacking, and tailings reduction.
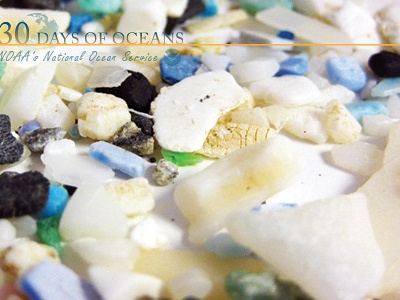
Microplastics
Microplastics are tiny plastic particles from degradation, cosmetics, clothing fibers and tires; they persist in water, are ingested by wildlife, and may transport chemicals. Monitored by particle counts in water or sediment. Mitigate with waste reduction, filtration, and better product design.
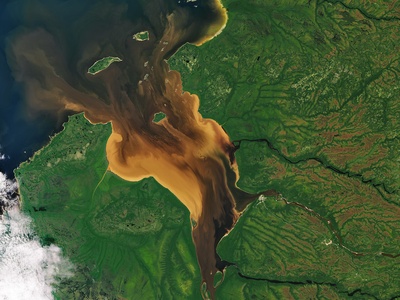
Sediment / turbidity
Excess sediment increases turbidity, smothers habitats, transports attached pollutants, and degrades drinking-water treatment. Measured as NTU or mg/L suspended solids. Common after land disturbance. Prevent with erosion controls, riparian buffers, sediment basins and low-impact development.
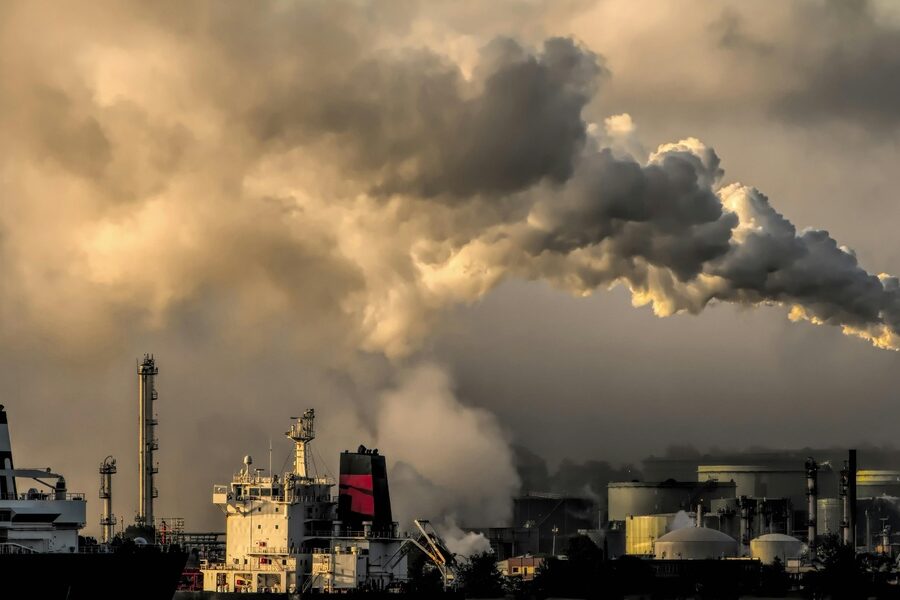
Thermal pollution
Thermal pollution warms water bodies via heated effluents, reducing dissolved oxygen, altering species ranges and harming sensitive organisms. Measured in °C change and DO impacts. Typical near coastal and river power plants; mitigation includes cooling towers, discharge mixing and returning water at lower temperatures.
Radiological contamination (Fukushima)
Radiological contamination releases radioactive isotopes into water after accidents or leaks, posing acute and long-term health risks and bioaccumulation in seafood. Measured in becquerels per liter (Bq/L). Fukushima Daiichi (2011) contaminated coastal waters; mitigation includes containment, dilution limits, and monitoring.