Coastal communities and meteorologists rely on historical storm records to improve preparedness and track long-term trends across ocean basins. Reviewing past systems helps show how intensity, location and seasonality have shifted over decades and where vulnerabilities remain.
There are 20 Examples of Hurricanes, ranging from Andrew to Yasi, chosen to illustrate a variety of years and intensities; each entry is organized with Year,Basin,Peak wind (km/h) so you can quickly compare when and where each storm peaked — details you’ll find below.
How were the storms on this list selected?
The list focuses on notable hurricanes that illustrate geographic spread, differing intensities and available reliable data; selections favor storms with clear records from official sources so the Year,Basin,Peak wind (km/h) fields are consistent and comparable.
Can I trust the “Peak wind (km/h)” values for direct comparisons?
Peak wind figures come from best-track or post-storm analyses by meteorological agencies and are useful for relative comparisons, but bear in mind measurement methods and reporting standards vary by basin and era, so use them as a guideline and check original agency notes for precise context.
Examples of Hurricanes
| Name | Year | Basin | Peak wind (km/h) |
|---|---|---|---|
| Katrina | 2005 | Atlantic | 280 |
| Andrew | 1992 | Atlantic | 280 |
| Irma | 2017 | Atlantic | 285 |
| Maria | 2017 | Atlantic | 280 |
| Harvey | 2017 | Atlantic | 215 |
| Sandy | 2012 | Atlantic | 185 |
| Michael | 2018 | Atlantic | 260 |
| Wilma | 2005 | Atlantic | 295 |
| Mitch | 1998 | Atlantic | 285 |
| Camille | 1969 | Atlantic | 305 |
| Patricia | 2015 | Eastern Pacific | 345 |
| Haiyan | 2013 | Western Pacific | 315 |
| Tip | 1979 | Western Pacific | 305 |
| Ida | 2021 | Atlantic | 240 |
| Hugo | 1989 | Atlantic | 260 |
| Ivan | 2004 | Atlantic | 270 |
| Dorian | 2019 | Atlantic | 295 |
| Yasi | 2011 | Australian region (Southern Hemisphere) | 230 |
| Nargis | 2008 | North Indian Ocean | 165 |
| Sidr | 2007 | North Indian Ocean | 215 |
Images and Descriptions
Katrina
Catastrophic Category 5 Atlantic hurricane that struck Louisiana and the Gulf Coast in 2005. Peaked at 280 km/h, caused catastrophic New Orleans flooding, roughly 1,836 deaths and around $125,000,000,000 in damage; defining modern example of storm surge and urban impacts.

Andrew
1992 Category 5 that devastated South Florida and Louisiana, peaking at 280 km/h. Caused widespread destruction, about 65 deaths and $27,000,000,000 in damage; prompted major changes in U.S. building codes and insurance practices.
Irma
2017 Category 5 Atlantic hurricane that ravaged Caribbean islands and Florida. Peak winds near 285 km/h; caused widespread destruction, over 130 deaths and roughly $77,000,000,000 in damages; notable for longevity and extreme intensity across many islands.
Maria
2017 Category 5 hurricane that devastated Puerto Rico and the northeastern Caribbean. Peak winds near 280 km/h; caused catastrophic infrastructure failure, thousands of deaths (est. 2,975) and roughly $90,000,000,000 in damage, sparking major humanitarian concerns.
Harvey
2017 Atlantic hurricane that stalled over Texas, peaking near 215 km/h. Notable for extreme rainfall and catastrophic flooding in Houston, about 107 deaths and roughly $125,000,000,000 in damages; a benchmark storm for inland flood impacts.
Sandy
2012 large hurricane that impacted the Caribbean and U.S. East Coast, peaking at 185 km/h before transitioning. Caused massive coastal flooding, about 233 deaths and roughly $70,000,000,000 in damage; notable for storm surge in New Jersey and New York.
Michael
2018 Gulf Coast Category 5 that struck the Florida Panhandle with 260 km/h winds. Caused severe wind and storm-surge damage, about 74 deaths and roughly $25,000,000,000 in losses; notable for rapid intensification before landfall.
Wilma
2005 Atlantic Category 5 with a record-low central pressure and peak winds near 295 km/h. Severely impacted Mexico and Florida, causing about 87 deaths and roughly $29,000,000,000 in damage; notable for intense rapid intensification.
Mitch
1998 devastating Atlantic hurricane that battered Central America with peak winds around 285 km/h. Most fatalities resulted from flooding and landslides—over 11,000 deaths—and large economic losses, making it one of the deadliest Atlantic storms.
Camille
1969 Atlantic Category 5 that struck the U.S. Gulf Coast, peaking near 305 km/h. Caused intense storm surge and wind damage, about 259 deaths and over $1,420,000,000 in damage (1969 USD); remembered for extreme intensity at landfall.
Patricia
2015 Eastern Pacific hurricane with a record peak intensity of about 345 km/h. Struck western Mexico but produced limited damage relative to intensity; notable as the strongest tropical cyclone reliably measured in the Western Hemisphere.
Haiyan
2013 Western Pacific super typhoon (Philippines name Yolanda) with peak winds near 315 km/h. One of the strongest landfalls in recorded history, it killed over 6,300 people and caused massive destruction across the central Philippines.

Tip
1979 Western Pacific super typhoon with peak winds around 305 km/h and a record-low pressure of 870 mb. Also the largest tropical cyclone on record; influential for understanding extreme tropical cyclone size and intensity.

Ida
2021 Atlantic hurricane that made powerful landfall in Louisiana with peak winds near 240 km/h. Later caused catastrophic flooding in the U.S. Northeast; resulted in over 100 deaths and estimated damages of about $75,000,000,000.
Hugo
1989 Atlantic Category 5 that struck the Caribbean and U.S. territories, peaking near 260 km/h. Caused widespread destruction, about 107 deaths and roughly $10,000,000,000 in damages; historically significant for Caribbean impact and recovery.
Ivan
2004 Atlantic Category 5 with peak winds near 270 km/h, which affected the Caribbean, Jamaica, the Cayman Islands and the U.S. Gulf Coast. Caused severe damage, about 124 deaths and roughly $26,000,000,000 in economic losses.
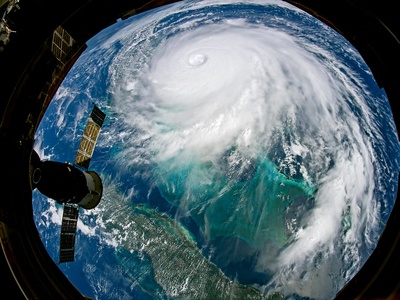
Dorian
2019 Atlantic Category 5 that stalled over the Bahamas with peak winds around 295 km/h. Caused catastrophic destruction on Abaco and Grand Bahama, dozens of deaths and widespread devastation; notable for extreme intensity and slow motion.
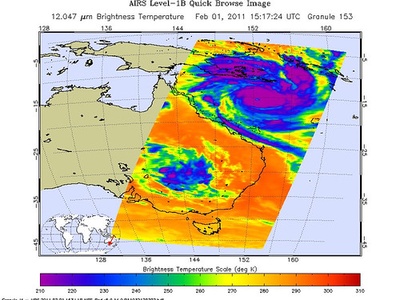
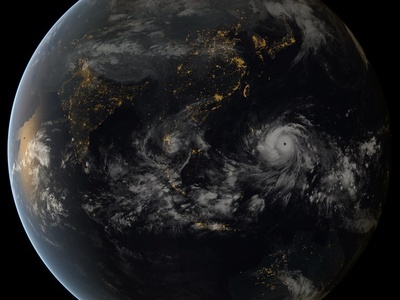
Yasi
2011 Australian region cyclone that struck Queensland with peak winds near 230 km/h. Caused massive agricultural and infrastructure damage, widespread power outages and injuries; one of Australia’s most damaging and studied cyclones.
Nargis
2008 North Indian Ocean cyclone that struck Myanmar with peak winds near 165 km/h. Caused catastrophic storm surge and flooding; official and estimated deaths exceed 138,000, making it one of the deadliest tropical cyclones on record.
Sidr
2007 North Indian Ocean cyclone that hit Bangladesh with peak winds around 215 km/h. Caused severe storm surge and widespread destruction, killing over 3,447 people and causing roughly $1,700,000,000 in damage; notable for humanitarian impact.