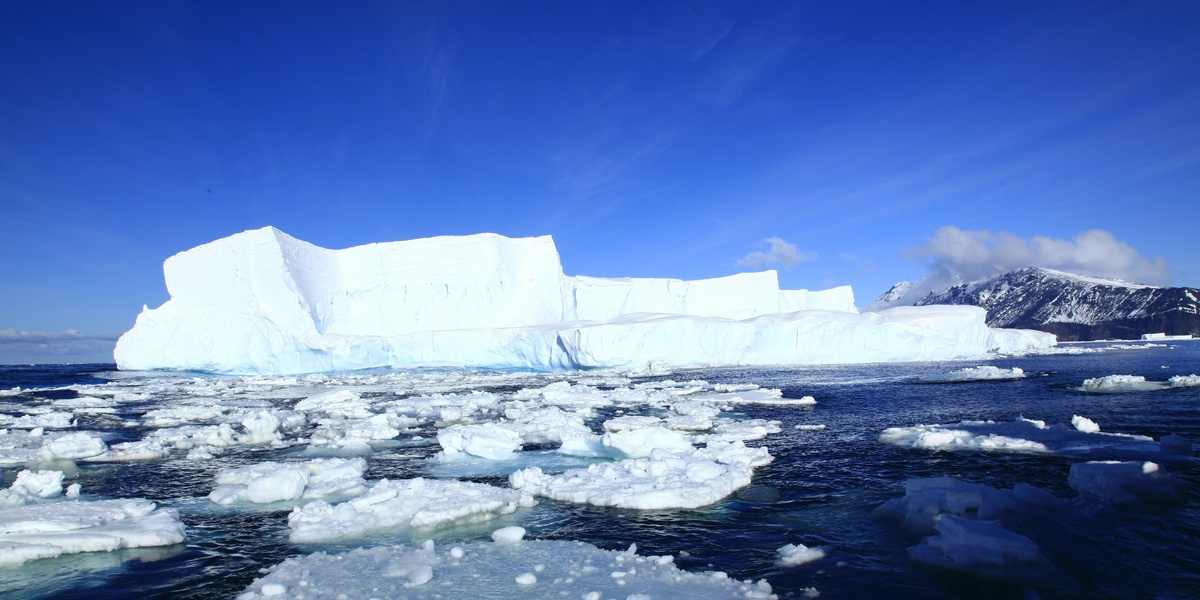
Global surface temperatures have risen about 1.1–1.2°C since the late 19th century, and 2023 ranked among the warmest years on record.
That rise has generated a steady stream of claims—some accurate, many misleading. Political framing, short news cycles, and vested interests all help myths persist. The result: confused public debate and delayed action.
Sorting fact from fiction matters because policy choices, personal preparedness, and investments depend on public understanding. Below we debunk eight common misconceptions, show the evidence (with numbers and examples), and explain practical implications and solutions.
Scientific causes and basic misunderstandings
This group focuses on what drives recent warming and how scientists know it. Multiple independent records—IPCC AR6 (2021/2023 summaries), NOAA, and NASA—point to the same conclusion: human activities are the dominant cause.
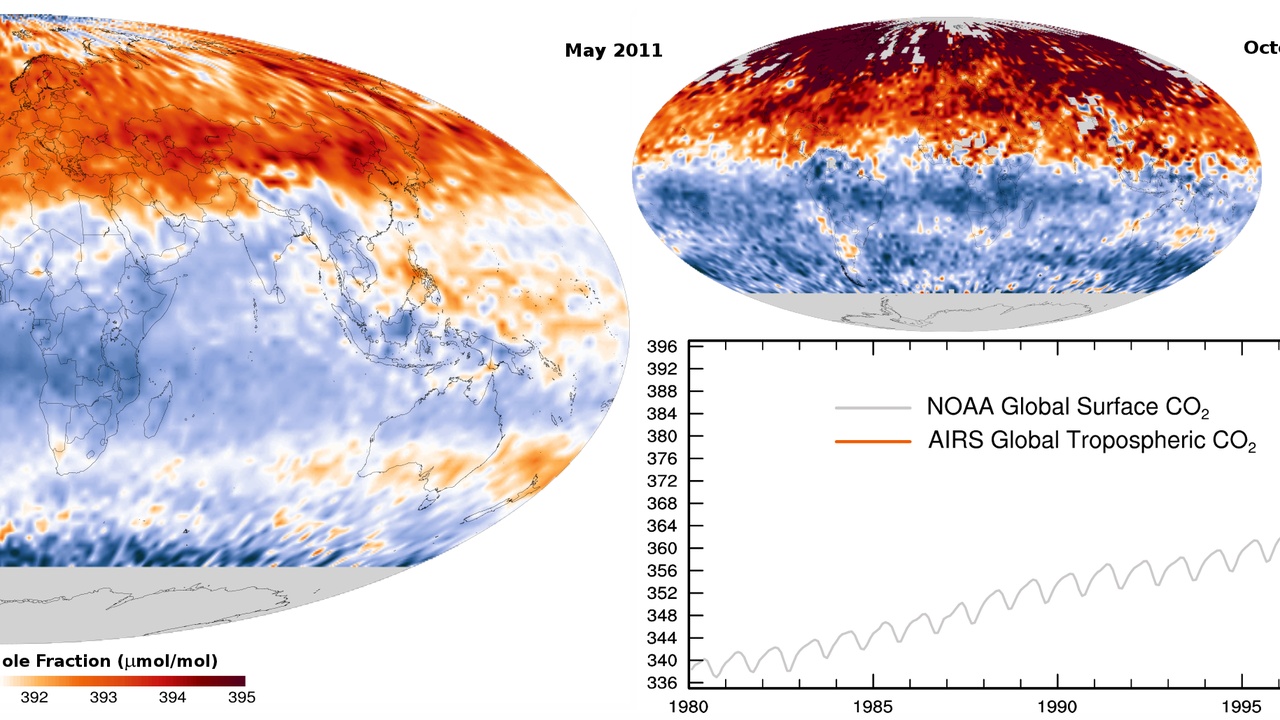
Why scientific clarity matters: it shapes mitigation and adaptation choices. Key measurements include atmospheric CO2 rising from roughly 280 ppm in pre‑industrial times to over 420 ppm in 2023, temperature records showing a long-term warming trend, and radiative forcing estimates used in climate models.
These lines of evidence converge. That makes the science stronger, not weaker, and gives policymakers a factual basis for decisions about energy, infrastructure, and public health.
1. Myth: Recent warming is just natural cycles (solar/volcanic/oscillations)
Claim: recent warming is explained by natural cycles rather than human activity.
The evidence contradicts that claim. Atmospheric CO2 climbed from about 280 ppm before 1750 to over 420 ppm today. IPCC AR6 estimates CO2 radiative forcing since 1750 at roughly 1.68 W/m². Solar irradiance has not increased in step with global temperature since about 1950, and volcanic eruptions produce short-term cooling, not long-term warming.
Concrete examples: Milankovitch orbital cycles operate on 10,000–100,000 year timescales, so they can’t explain rapid 20th‑century warming. The 1991 Mount Pinatubo eruption caused about a 0.4°C temporary drop in global temperatures. And multiple surveys find over 97% of publishing climate scientists agree humans are the main cause.
Implication: treating natural variability as the main driver misdirects policy and delays emissions reductions that actually change radiative forcing.
2. Myth: Global warming stopped or we’re entering a cooling period
Claim: recent short-term dips mean the long-term warming trend has ended.
Trend matters more than year-to-year noise. The last decade is the warmest on record, and years like 2016, 2019, 2020, and 2023 rank among the hottest. The long-term global mean surface temperature has risen about 1.1–1.2°C since the late 19th century.
Short-term variability, such as La Niña and El Niño cycles, can mask or amplify warming for one to a few years. Media focus on a cool year fuels the myth, but the decadal trend remains upward.
Real-world consequence: underestimating the trend can delay adaptation measures like heatwave planning and urban cooling strategies that save lives.
3. Myth: Carbon dioxide is too weak a greenhouse gas to cause major warming
Claim: CO2’s effect is too small to drive serious warming.
Here’s the thing: small changes in the atmosphere’s energy balance matter. CO2 added about 1.68 W/m² of forcing since 1750 (IPCC). That forcing combines with other gases—methane and nitrous oxide add further positive forcing—and with feedbacks like increased water vapor and reduced ice reflectivity.
Paleoclimate records show that CO2 doubling tends to correspond with global temperature changes of several degrees once feedbacks operate. Today’s CO2 increases come from burning fossil fuels, cement production, and land‑use change, so they are directly linked to human activity.
Implication: ignoring CO2’s role ignores the primary lever we have to change the future climate trajectory.
Impacts, models, and timing myths
This set tackles claims that downplay impacts or deny the usefulness of projections. Uncertainty exists in timing and regional detail, but the direction and many magnitudes of change are well supported by observations and model ensembles.
Observed impacts are already happening, and models—tested by hindcasts—help planners assess risk under different emissions scenarios (SSPs/RCPs).
4. Myth: Sea-level rise and impacts are exaggerated and won’t harm many people
Claim: sea-level rise will be minor and affect few people.
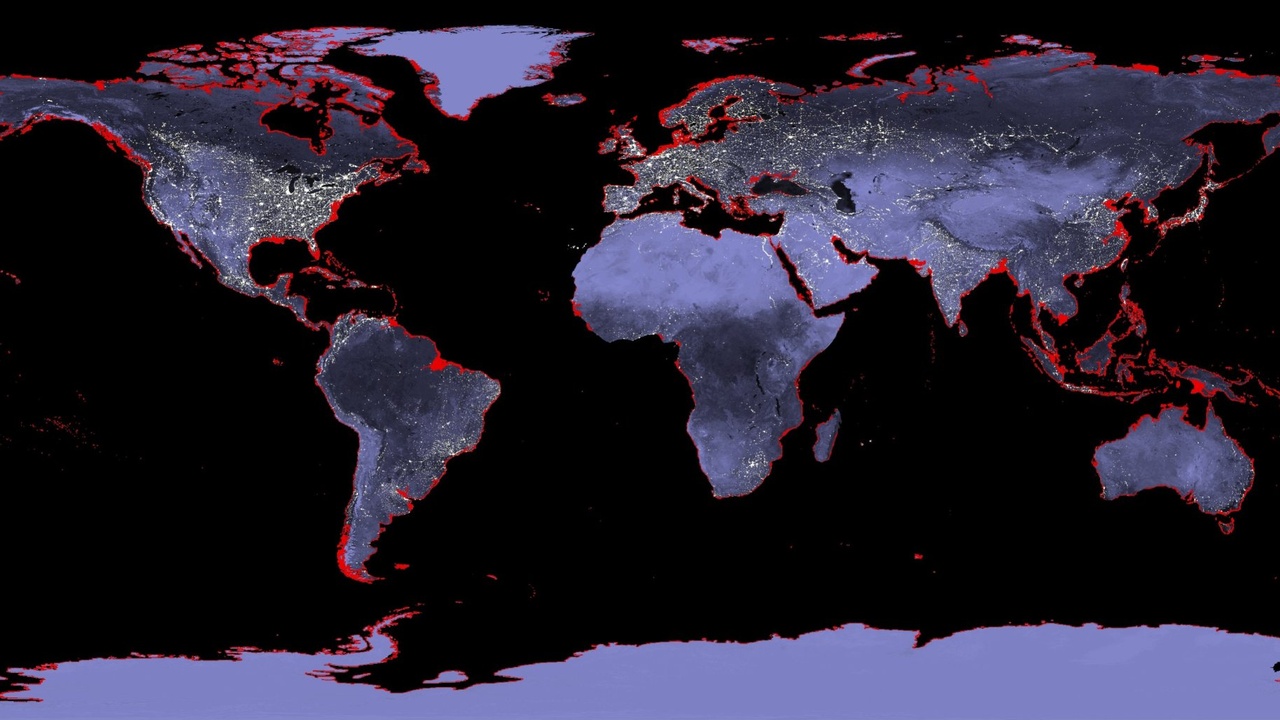
Measured facts say otherwise. Global mean sea level has risen about 20 cm since 1900, and the rate has accelerated in the satellite era. IPCC projects roughly 0.3–1.0 m of rise by 2100 depending on emissions and ice‑sheet responses.
Hundreds of millions of people live in low-lying coastal zones. Higher baseline levels make storm surge and king tides far more damaging. Examples include increasing tidal nuisance flooding in Miami and chronic coastal erosion and displacement in parts of Bangladesh.
Implication: planning that ignores rising seas will increase long-term costs and human suffering.
5. Myth: Extreme weather trends aren’t connected to global warming
Claim: extreme events are natural and not linked to warming.
Attribution science has matured. Statistical and physical methods now link higher temperatures to more frequent and intense heatwaves, stronger atmospheric moisture content that drives heavy rainfall, and longer wildfire seasons in many regions.
Examples: the 2003 European heatwave and the 2021 Pacific Northwest heatwave caused many deaths and were shown to be far more likely due to human-driven warming. Studies have also linked increased heavy precipitation in many regions to rising temperatures, and 2020 saw devastating wildfire seasons in western North America.
Implication: infrastructure, agriculture, and public health systems must account for a higher baseline risk of extremes.
6. Myth: Climate models are unreliable, so projections can’t be trusted
Claim: models are too uncertain to guide policy.
Models have limits, but they reproduce broad historical trends when run with observed forcings. Multi-model ensembles capture structural differences and provide ranges that planners use for risk assessment. IPCC relies on ensembles and scenario analysis (SSPs) to show plausible futures.
Sources of uncertainty include regional precipitation, cloud feedbacks, and the timing of potential rapid ice-sheet changes. Still, models consistently project large-scale warming under continued emissions, which is actionable for infrastructure and mitigation planning.
Example: many models correctly hindcast much of the 20th‑century warming when given historical forcings, increasing confidence in their large‑scale projections.
Policy, economics, and solution myths
This category covers cost, feasibility, and policy misunderstandings. Economic analyses (Stern Review, IEA, World Bank) show the costs of inaction can exceed mitigation costs by a wide margin.
Good policy design can reduce transition costs, protect vulnerable workers, and create new jobs in clean energy industries.
7. Myth: Cutting emissions will wreck the economy and cost more than the damage of warming
Claim: mitigation will cause unacceptable economic harm.
Evidence shows mitigation costs are manageable and that unchecked warming risks much larger losses. The Stern Review and subsequent analyses estimate large welfare and GDP impacts in high-emission scenarios. The IEA finds that energy transitions can be done affordably with the right policies.
Concrete numbers: utility-scale solar PV costs have dropped by more than 80% since 2010. Renewable energy sectors now employ millions worldwide. Carbon pricing exists in systems like the EU ETS and British Columbia, showing tools that cut emissions while preserving economic activity.
Implication: well-designed mitigation can protect the economy and create opportunities; policy choices determine the distributional impacts.
8. Myth: Renewable energy and current technologies can’t reliably power modern economies
Claim: renewables can’t provide reliable power at scale.
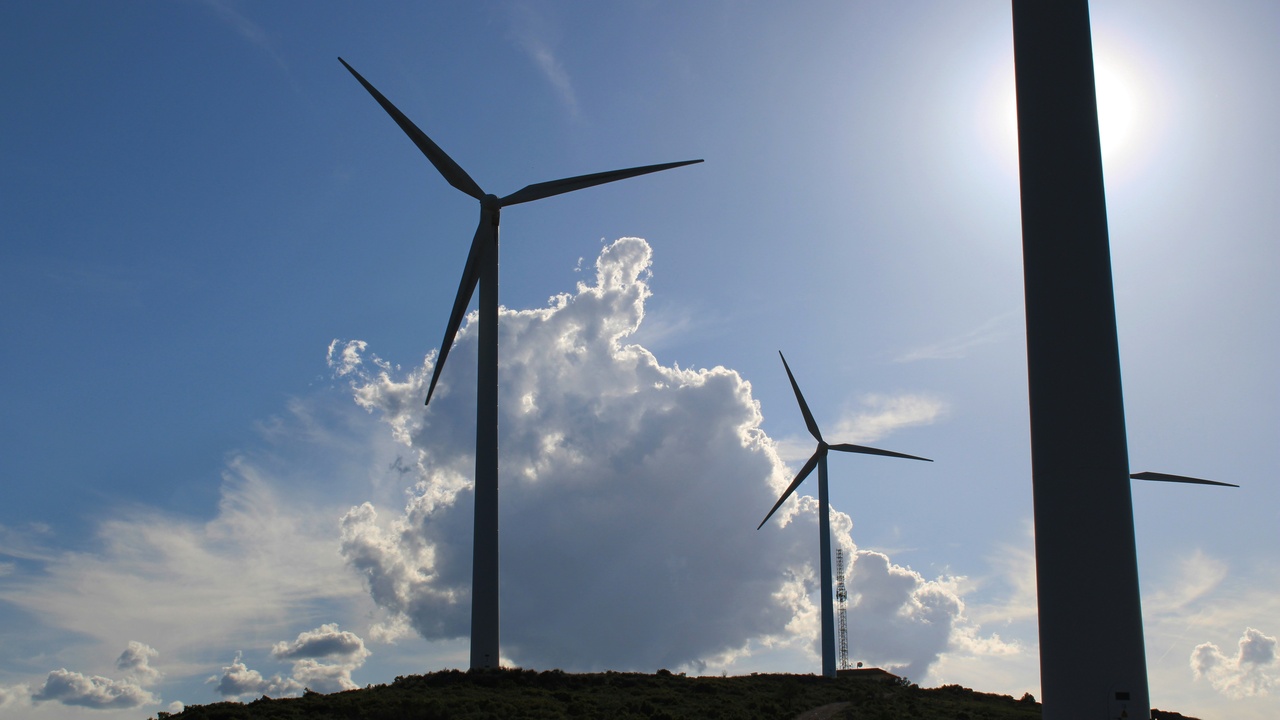
Modern grid design moves beyond the old “baseload” model toward flexibility. A mix of wind, solar, storage (batteries, pumped hydro), demand response, transmission upgrades, and flexible generation can support very high renewable shares.
Examples: some regions already see days with more than 50% of electricity from renewables (Denmark, parts of Germany, California on sunny/windy days). The Hornsdale Power Reserve in Australia showed how a large battery can stabilize frequency and provide fast response. Battery costs and deployments have risen rapidly, and pumped hydro remains a large-scale storage option.
Implication: delaying deployment locks in high-carbon infrastructure and raises long-term system costs.
Summary
- Human activities—especially burning fossil fuels—are the dominant cause of recent warming, supported by CO2 rising from ~280 ppm to >420 ppm and multiple independent lines of evidence (IPCC, NOAA, NASA).
- Short-term variability (El Niño/La Niña, volcanic cooling) does not overturn the long-term warming trend of about 1.1–1.2°C since the late 19th century.
- Impacts like sea-level rise (~20 cm since 1900) and more intense heat and heavy precipitation are already measurable; attribution science links many extremes to warming.
- Mitigation costs have fallen (solar PV >80% cost decline since 2010), and policy tools like carbon pricing and grid modernization can cut emissions while supporting jobs and reliability.
- Do your part: support evidence-based policy, reduce energy waste, choose low-carbon options, and follow reputable sources such as IPCC, NOAA, and NASA for updates.