In labs, classrooms, and business analytics teams alike, deciding which statistical test to use can feel like navigating a crowded toolbox. A clear list helps you match questions, data, and assumptions so you spend less time guessing and more time interpreting results.
There are 20 Examples of Statistical Tests, ranging from Chi-square goodness-of-fit to Wilcoxon signed-rank test. For each test you’ll find below concise entries organized by Purpose, Data type, Key assumptions to help you compare uses and limits quickly — you’ll find below.
How do I choose the right statistical test for my data?
Match the question (difference, association, prediction), the measurement scale (categorical, ordinal, interval/ratio), and whether assumptions like normality or equal variances hold. Use the Purpose, Data type, Key assumptions columns below to narrow options: parametric tests when assumptions hold, otherwise pick an appropriate nonparametric alternative.
Can I use nonparametric tests like the Wilcoxon signed-rank test with small samples?
Yes—nonparametric tests are often better for small samples or skewed data because they don’t assume normality. They can be less powerful than parametric tests when assumptions are met, so check data shape and report effect sizes alongside p-values.
Examples of Statistical Tests
| Test name | Purpose | Data type | Key assumptions |
|---|---|---|---|
| One-sample t-test | Compare sample mean to known value | continuous | Normality, independence, interval/ratio data |
| Independent t-test | Compare means of two independent groups | continuous | Normality, equal variances, independent samples |
| Welch’s t-test | Compare two means with unequal variances | continuous | Normality, independent samples; unequal variances allowed |
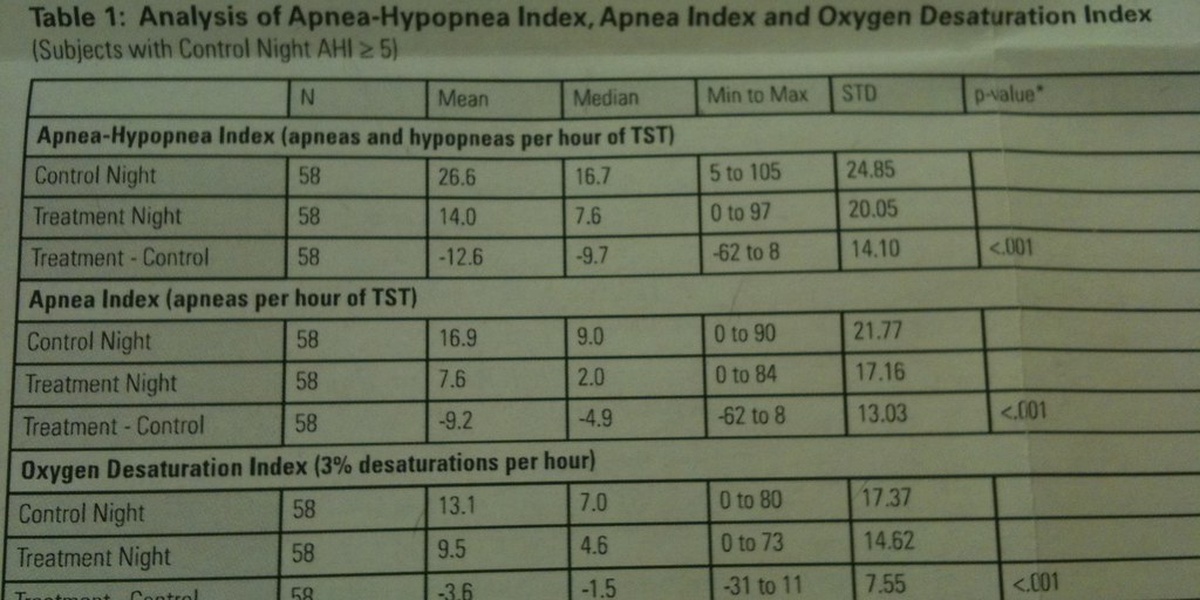
| Paired t-test | Compare means of paired observations | paired | Differences approximately normal, paired design |
| One-way ANOVA | Compare means across three or more groups | continuous | Normality, equal variances, independent groups |
| Repeated measures ANOVA | Test mean differences across time or conditions | paired | Sphericity, normal residuals, correlated observations |
| Chi-square test of independence | Test association between two categorical variables | categorical | Expected counts sufficiently large, independent observations |
| Chi-square goodness-of-fit | Test if observed categories match expected distribution | categorical | Adequate expected counts, independent observations |
| Fisher’s exact test | Test association in small-sample categorical tables | categorical | Small sample, fixed margins, exact calculation |
| Mann-Whitney U (Wilcoxon rank-sum) | Compare two independent groups nonparametrically | ordinal | Independent samples, similarly-shaped distributions |
| Wilcoxon signed-rank test | Compare paired samples nonparametrically | paired | Paired differences symmetric, ordinal/continuous data |
| Kruskal-Wallis test | Compare three+ groups nonparametrically | ordinal | Independent samples, similarly-shaped distributions |
| Friedman test | Compare matched groups across multiple conditions nonparametrically | paired | Paired blocks, ordinal data, consistent ranking |
| Pearson correlation test | Test linear association between two continuous variables | continuous | Linearity, bivariate normality, no influential outliers |
| Spearman rank correlation | Test monotonic association using ranks | ordinal | Monotonic relationship, ordinal/continuous data |
| Simple linear regression (t-test for slope) | Test predictor effect on continuous outcome | continuous | Linearity, independent errors, homoscedasticity, normal residuals |
| Logistic regression (Wald test) | Test predictors’ effects on binary outcome | categorical | Linearity on logit, independent observations |
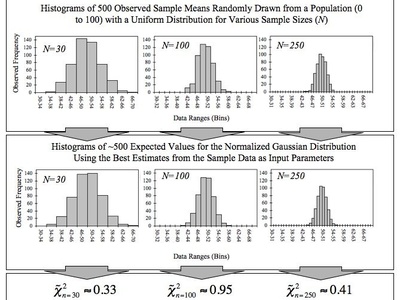
| Shapiro-Wilk test | Test normality of a continuous sample | continuous | Independent observations, continuous data |
| Kolmogorov-Smirnov (two-sample) | Compare two continuous distributions | continuous | Independent samples, continuous distributions |
| Log-rank test | Compare survival curves between groups | continuous | Independent censoring, proportional hazards approximately |
Images and Descriptions

One-sample t-test
Test whether a sample mean differs from a known value. Example: check if average battery life equals 10 hours. Use when you have continuous data and want to compare to a specific population mean.
Independent t-test
Compare means between two unrelated groups. Example: compare test scores of two classrooms. Use when outcome is continuous and groups are independent and roughly normal.
Welch’s t-test
Like the independent t-test but robust to unequal variances. Example: compare incomes when group variances differ. Use when sample sizes or variances are unequal.
Paired t-test
Test mean difference in matched or repeated measurements. Example: before-and-after blood pressure for same patients. Use for continuous outcomes from paired samples.
One-way ANOVA
Tests whether at least one group mean differs across multiple groups. Example: compare mean weight across three diets. Follow with post-hoc tests if significant.
Repeated measures ANOVA
Compare means across several related measurements. Example: measure cholesterol at baseline, 3, and 6 months in same subjects. Use for within-subject designs with >2 time points.
Chi-square test of independence
Assess whether two categorical variables are related. Example: test association between smoking status and disease presence in a contingency table.
Chi-square goodness-of-fit
Check whether observed category frequencies match expected proportions. Example: test if a die is fair by comparing face counts to uniform expectation.
Fisher’s exact test
Exact test for 2×2 contingency tables when counts are small. Example: evaluate treatment success vs failure with few patients; use instead of chi-square.
Mann-Whitney U (Wilcoxon rank-sum)
Nonparametric alternative to t-test using ranks. Example: compare pain scores between groups when data are skewed; tests whether distributions differ.
Wilcoxon signed-rank test
Nonparametric paired test for median differences. Example: compare symptom scores before and after treatment when differences are not normal.
Kruskal-Wallis test
Nonparametric ANOVA alternative using ranks. Example: compare median satisfaction across three stores when data are skewed.
Friedman test
Nonparametric test for repeated measures with >2 conditions. Example: judges rank three products; test whether rankings differ across products.
Pearson correlation test
Assess linear relationship strength. Example: test correlation between height and weight. Use when both variables are continuous and relationship appears linear.
Spearman rank correlation
Rank-based correlation for monotonic relationships. Example: correlate customer satisfaction ranks with purchase frequency when data aren’t normal.
Simple linear regression (t-test for slope)
Models outcome as a function of a predictor; t-test on slope tests association. Example: test whether study hours predict exam score.
Logistic regression (Wald test)
Models binary outcomes; Wald or likelihood tests assess predictors. Example: test whether age predicts disease presence in adjusted model.
Shapiro-Wilk test
Assess whether a sample appears normally distributed. Example: test if residuals or measurements follow normality before parametric tests.
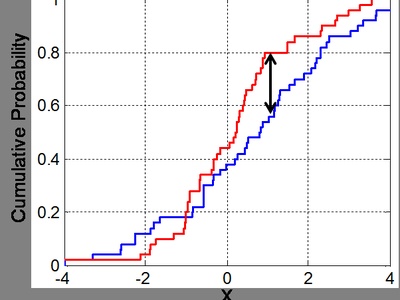
Kolmogorov-Smirnov (two-sample)
Nonparametric test comparing full distributions. Example: test if reaction time distributions differ between groups; sensitive to shifts and shape differences.
Log-rank test
Compare time-to-event distributions across groups. Example: compare survival between treatment and control in a clinical trial; used in Kaplan–Meier analysis.