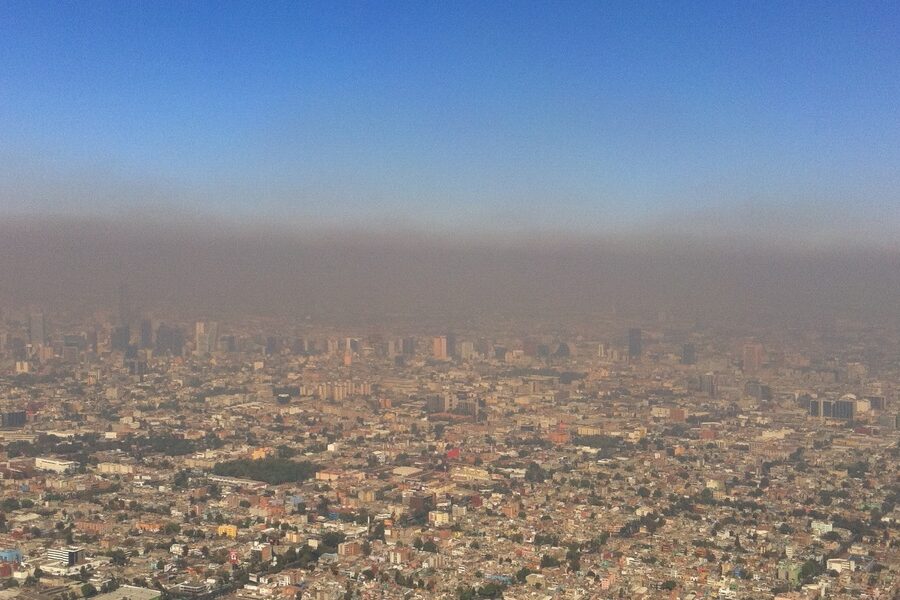
The first Earth Day in 1970 mobilized 20 million Americans and crystallized modern environmental monitoring as a public priority.
Complex environmental problems — from polluted drinking sources to changing coastlines and shifting species ranges — demand accurate measurement to protect public health and manage resources. More than 50 years of satellite data (for example, the Landsat archive since 1972) give long-term context, while on-the-ground measurements and lab analyses provide the detail that regulators and managers rely on.
Modern environmental science depends on a mix of field instruments, remote sensing platforms, laboratory analyzers, and data tools — each one essential for diagnosing problems and shaping solutions.
This article gives seven concrete examples grouped into three practical categories: field measurement tools, remote sensing and mapping platforms, and analytical and data tools. Whether you care about public health, resource management, or climate adaptation, these instruments and platforms show how decisions get grounded in measurement.
Field measurement tools for on-site data
Direct, on-site measurements remain the foundation of environmental monitoring because they provide ground-truth for models, support regulatory compliance, and enable rapid responses like boil-water notices or targeted remediation. Field tools are built to be rugged and portable for repeated sampling, and many follow EPA or international sampling protocols to ensure legal defensibility.
Field-collected data validate remote observations, inform immediate management decisions, and support long-term ecological monitoring plots or community science campaigns.
1. GPS and GNSS receivers for precise location and timing
GNSS devices provide precise coordinates and timestamps for every sample or observation, making repeat sampling and legal mapping possible.
Systems include GPS, GLONASS, and Galileo, with RTK/PPK differential techniques offering centimeter-level accuracy. RTK GNSS can provide centimeter accuracy, which greatly improves plot relocation and mapping precision.
Industry leaders include Trimble and Leica. Common field units range from Garmin handhelds and smartphone-integrated GNSS with external antennas to survey-grade receivers like the Trimble R2 used in vegetation surveys. Consumer handhelds can cost under $500, while survey-grade RTK systems run into the several-thousand-dollar range.
2. Multiparameter water-quality sondes and handheld meters
Multiparameter sondes and portable meters measure temperature, pH, dissolved oxygen, conductivity, turbidity, and often chlorophyll in real time.
Common products include YSI EXO sondes and Hach Hydrolab instruments, and many EPA monitoring programs rely on logged readings from these devices for freshwater and coastal assessments. Typical logging intervals are 15 minutes or finer during storm events.
Utilities and researchers use sondes to detect algal blooms or contamination spikes. For example, a drinking-water utility might deploy a YSI EXO during a storm to watch turbidity rise and decide whether to alter treatment; field calibration routines are often daily to weekly depending on sensors and conditions. Citizen science programs also use handheld meters for wider community monitoring.
3. Soil corers and augers for solid-sample collection
Soil corers and augers allow scientists to collect intact samples for physical, chemical, and biological analyses.
Tools like the Eijkelkamp auger and hand-held Edelman corer are standard in soil surveys and contamination assessments. Topsoil studies typically sample 0–30 cm depths, while profile analyses go deeper as needed.
Applications include quantifying soil carbon for greenhouse-gas inventories, mapping heavy-metal contamination around industrial sites, and informing hydrological models. A remediation team might sample with augers every 10 meters to map a contamination plume and guide excavation work.
Remote sensing and mapping platforms
Remote sensing scales observation from local plots to entire regions and decades, making it possible to detect trends and hotspots that no single field crew could cover.
Satellites, aircraft, and drones complement field data by providing broad spatial coverage and repeat observations. The Landsat archive (1972–present) and the Sentinel program (since 2014) offer multi-decadal baselines that support trend analysis over time.
These platforms feed into GIS and cloud processing tools so scientists can map change, assess impacts after storms, and prioritize field campaigns.
4. Satellite imagery and GIS for landscape analysis
Satellite imagery from Landsat, Sentinel, and MODIS combined with GIS software like ArcGIS or QGIS is central to land-cover mapping, deforestation tracking, and change detection.
The USGS Landsat archive spans 1972 to the present, while Sentinel-2 has provided frequent 10–20 meter imagery since 2014. These datasets enable analysts to calculate decade-long trends, for instance measuring a 10-year change in forest cover using 30-meter Landsat data.
Google Earth Engine lets teams process large time series efficiently; practitioners often use ArcGIS Pro for polished maps and QGIS for open-source workflows. Applications include mapping flood extents after storms and quantifying urban heat islands.
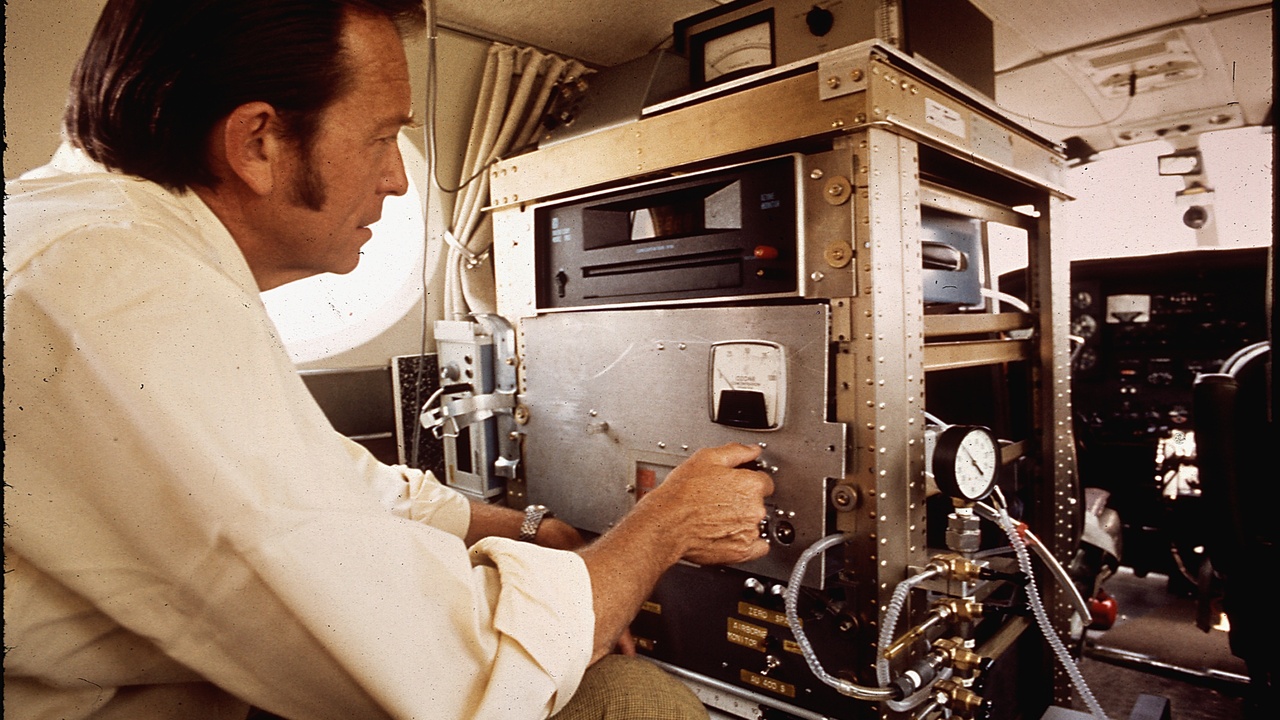
5. Drones (UAVs) and airborne sensors for high-resolution surveys
Drones carry cameras, multispectral sensors, and LiDAR to produce centimeter- to meter-scale maps that are ideal for small sites and rapid-response surveys.
Popular platforms include DJI Phantom and Mavic series for small-site mapping, senseFly eBee fixed-wing drones for larger-area surveys, and airborne LiDAR systems such as those from Riegl. Outputs include orthomosaics and digital elevation models; drone surveys can produce 5 cm orthophotos for restoration monitoring.
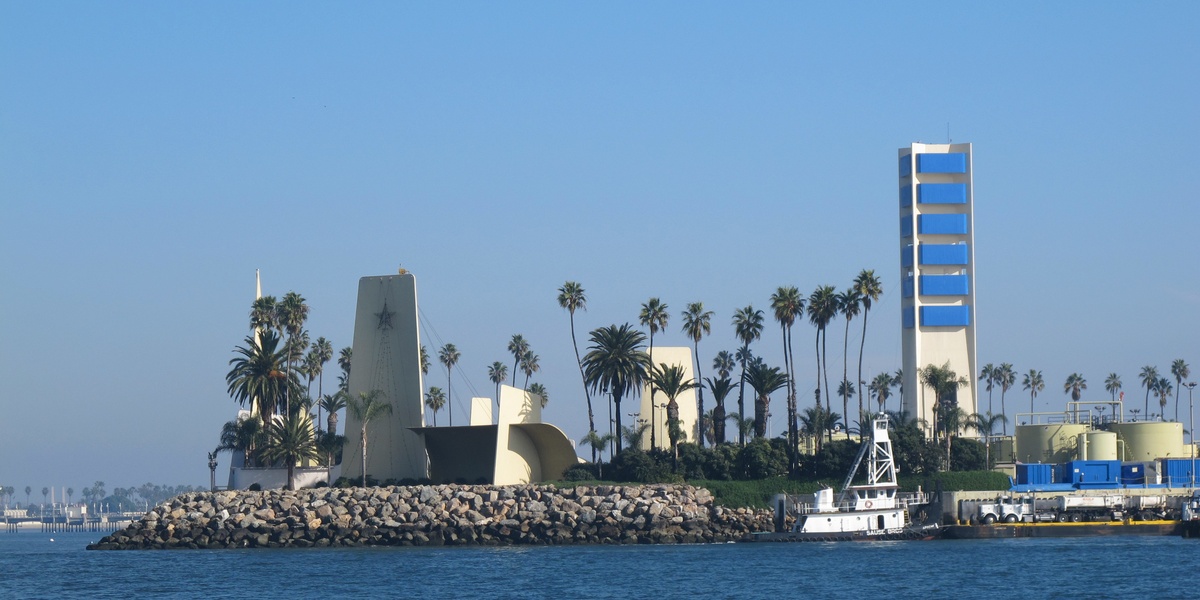
Use cases include measuring shoreline retreat (for example, studies documenting 1.2 meters/year of shoreline loss), surveying wetlands for habitat assessments, and checking mine-reclamation progress. Operators should follow local rules such as FAA Part 107 in the U.S., and typical flight altitudes vary by sensor and objective.
Analytical instruments and data tools
Laboratory analyzers and software turn samples and sensor logs into actionable insight. Lab instruments quantify contaminants and biomarkers, while data tools enable modeling, statistics, and visualization that guide management decisions.
These systems together make measurements defensible for regulation and policy, and they enable forecasts such as flood risk or species-distribution shifts under future climates.
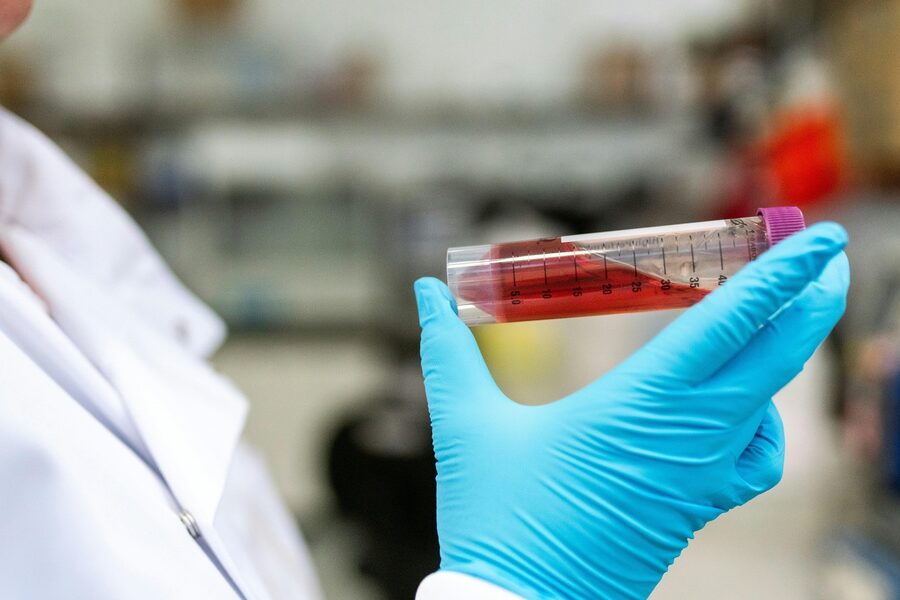
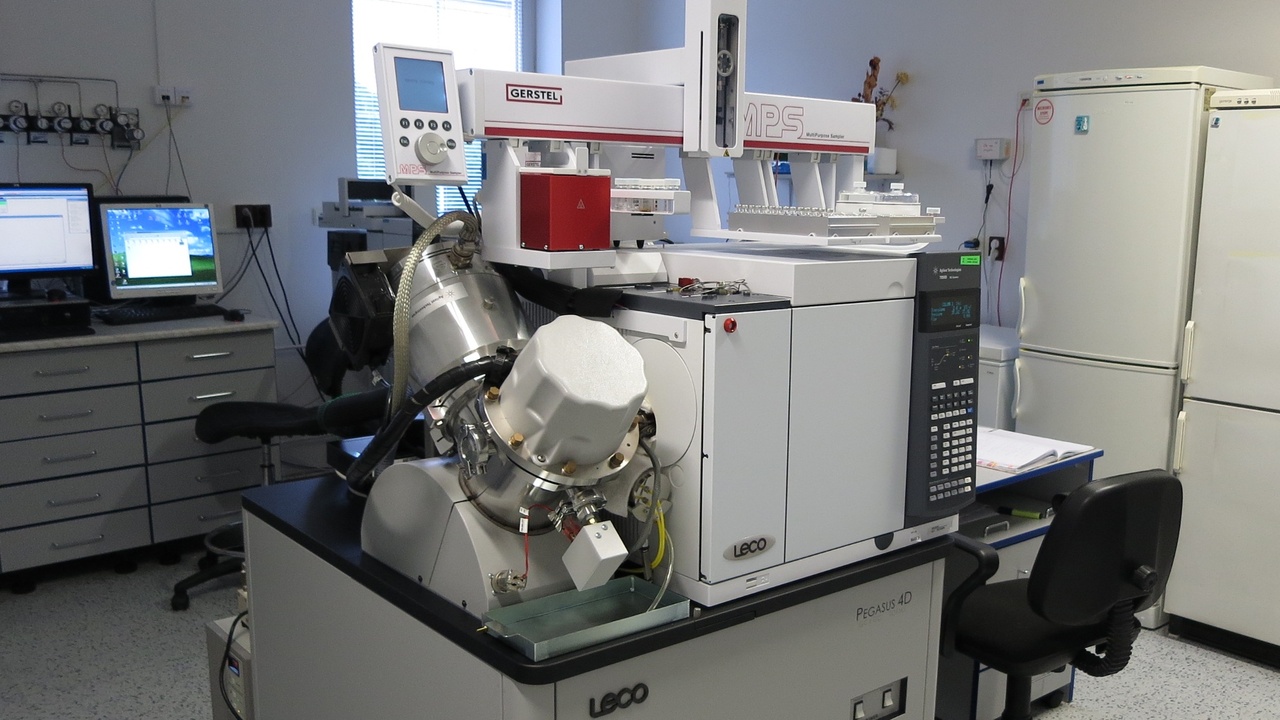
6. Laboratory analyzers: GC‑MS, ICP‑MS, and spectrophotometers
In the lab, instruments like gas chromatograph–mass spectrometers (GC‑MS), inductively coupled plasma mass spectrometers (ICP‑MS), and spectrophotometers quantify organic chemicals, metals, and nutrients.
GC‑MS (e.g., Agilent 7890 GC with a 5977 MSD) is widely used for organic-contaminant identification under EPA methods. ICP‑MS (such as Thermo Fisher iCAP) can detect metals down to low parts-per-trillion or parts-per-billion depending on the matrix. Spectrophotometers measure nutrients like nitrate and phosphate for eutrophication studies.
Real-world work includes detecting PFAS in drinking water, measuring mercury in sediments, and routine nutrient assays that inform lake management plans.
7. Data analysis and modeling software (R, Python, ArcGIS, Google Earth Engine)
Software is essential for cleaning data, running statistics, building geospatial models, and scaling results from plots to regions.
R and Python are standard for reproducible analysis (packages like tidyverse, sf, pandas, geopandas). Desktop GIS (ArcGIS, QGIS) supports mapping, while Google Earth Engine processes planetary-scale imagery — teams have processed tens of terabytes of imagery there for time-series analyses.
Hydrological and environmental models such as SWAT and HEC‑RAS inform water management. A typical workflow might use an R script to calculate 30-year NDVI trends or a Google Earth Engine routine to batch-process Sentinel-2 data from 2015–2024. Open-source tools lower the entry barrier for many practitioners.
Summary
- Field sensors and samplers provide ground truth and support immediate decisions, from boil-water notices to remediation plans.
- Remote sensing platforms scale observations in space and time — for example, Landsat’s archive since 1972 enables multi-decade trend analysis.
- Laboratory instruments such as GC‑MS and ICP‑MS measure contaminants at trace levels, while software (R, Python, ArcGIS, Google Earth Engine) turns measurements into models and maps.
- Practical entry points: explore the Landsat archive, try a QGIS or R tutorial, or join a local community monitoring program to see these tools in action.